Risk Assessment Studies
ReportNo. 13
Chemical Hazard Evaluation
DIETARY EXPOSURE TO MERCURY OF SECONDARY SCHOOL STUDENTS
(Follow-up Report)
May 2004
Food and Environmental Hygiene Department
The Government of the Hong Kong Special AdministrativeRegion
Correspondence:
Risk Assessment Section
Food and Environmental Hygiene Department
43/F, Queensway Government Offices,
66 Queensway, Hong Kong.
Email: enquiries@fehd.gov.hk
Table of Contents
Dietary Exposures to TotalMercury and Methylmercury
Concentrationof Total Mercury and Methylmercury
Dietary Exposures toTotal Mercury and Methylmercury
Conclusion and Recommendations
Abstract
In 2002, the Food and EnvironmentalHygiene Department conducted a study on "Dietary Exposureto Heavy Metals of Secondary School Students" andassessed whether there is any risk to the health ofsecondary school students resulting from the dietaryexposures to heavy metals. In view of the limitations in the previousstudy and the availability of methylmercury testinglocally, a follow-up study on dietary exposure tototal mercury and methylmercury was conducted to re-examinethe issue with a view to obtaining more precise estimatesof dietary exposure to mercury.
Dietary exposures to total mercury and methylmercurywere estimated by using the local food consumptiondata obtained in secondary school students and theconcentrations of total mercury and methylmercuryin food samples taken from the local market specificallyfor the study. More sophisticated laboratory analysis wasemployed with lower limit of detection.
The results of the study showed that the dietaryexposures to total mercury and methylmercury wereall within their respective Provisional TolerableWeekly Intakes (PTWIs) for both average and high consumers. The dietary exposures to total mercuryand methylmercury for average secondary school studentswere 0.92 and 0.35μg/kg bw/week respectively and thatfor high consumers were 2.33 and 0.87μg/kg bw/week respectively. It can be concluded that both the average consumersand high consumers among secondary school studentswould be unlikely to experience major toxicologicaleffects of total mercury and methylmercury.
The results also showed that the food group"fish" was identified as the main dietary source oftotal mercury and methylmercury, and the large predatoryfish, such as swordfish and tuna, had the highestconcentration of total mercury and methylmercury.
OBJECTIVE
This is a follow-up study aiming to (i) estimatemore precisely the dietary exposures to total mercuryand methylmercury by the secondary school studentsin HongKong and (ii) assess the health effects of total mercury and methylmercuryresulting from these exposures.
BACKGROUND
The Previous Study
2. The Food and Environmental Hygiene Department (FEHD) conducteda study on "Dietary Exposure to Heavy Metals of SecondarySchool Students"[1]in 2002. The study aimed to determine the dietaryexposure to heavy metals of secondary school studentsin Hong Kong so as to assess whetherthere are any risks to their health. Three heavy metals, namely arsenic, cadmiumand mercury, were chosen for the study.
3. The dietary exposure of secondary school students to the heavymetals were estimated in the previous study usingtwo sets of data. The levels of heavy metals were extractedfrom the database of the Food Surveillance Programmeof FEHD and the food consumption data was derivedfrom the Food Consumption Survey[2]conductedby FEHD in late 2000.
4. The previous study estimated that the dietary exposure to totalmercury for an average secondary school and high consumerwere 2.98 and 6.41μg/kg bw/week respectively. The exposure estimate for an average secondaryschool fell within the Provisional Tolerable WeeklyIntake (PTWI) of 5μg/kg bw/week while thatfor high consumer exceeded the PTWI. "Cereal and cereal products" and "vegetables"were found to be important dietary sources of totalmercury and this finding was not consistent with thosereported in the literature.
5. It was noted that there were certain limitations in the previousstudy. Inthe Food Surveillance Programme, which is mainly forenforcement purposes, analyses for mercury were determinedin form of total mercury rather than methylmercury.The limit of detection (LOD) was 30μg/kg, which was consideredhigh if used for research studies.
6. A value of 1/2 LOD was assigned to samples with levels belowLOD as a conservative approach and the majority ofsamples for the two food groups "cereal and cerealproducts" and "vegetables" have mercury levels belowLOD. Therelatively high LOD employed by the Food SurveillanceProgramme and the high amount of consumption for thesetwo food groups might have exaggerated the exposuresfrom them.
7. With the availability of methylmercury testing and the concernover its exposure and the limitations in the previousstudy, FEHD considered it necessary to re-examinethe issue with a view to obtaining a more preciseestimate of dietary exposure to mercury. More sophisticated methods of analysison both total mercury and methylmercury would be developedwith a lower detection limit. Food samples would be collected specificallyfor the study.
Mercury
8. Mercury (Hg) exists naturally in abundance in the environment. It enters the environment by both natural andhuman means. Mercury exists in three forms, namely metallic,inorganic and organic mercury. The forms can be altered under certain conditions. Mercury can be oxidized to inorganic bivalentmercury with the presence of organic matters in watersand can be converted back to metallic mercury in certainindustrial effluent. The inorganic mercury can also be convertedto methylated form by microorganisms especially inaquatic systems. Methylmercury bio-accumulates in the food chainand thus can result in high concentrations in largepredatory fish.[3]
Sources of Exposure
9. Contamination of food from both natural and human sources,dental amalgam and occupational exposure in agricultureand manufacturing sectors are possible routes of exposureto the chemicals. The dietary intake is the most dominantsource of exposure to mercury.[4]
10. In most foodstuffs, mercury is largely in the inorganic form. However, fish and other seafood products arethe main source of methylmercury, of which large predatoryspecies such as swordfish and tuna tend to accumulaterelatively higher levels. Methylmercury bio-accumulates as it moves upthe food chain, increasing in concentration at thesame time.[4]
Toxicological Effect
11. Mercury and its compounds have no known physiological functionsin animals. Theirpresence in human is considered as undesirable andmay be hazardous to health.[5]
12. Organic mercury compounds are more harmful than inorganic mercury. Methylmercury is the most common form of organicmercury and is regarded as highly toxic.
13. Methylmercury can cause adverse effect to the nervous system,especially the developing brain. Methylmercury passes more readily throughthe placenta than the other mercury compounds. Foetus exposed to methylmercury have beenfound to be born mentally retarded and with symptomssimilar to those of cerebral palsy. Pregnant mothers who received low level ofmethylmercury by normal adult standard may give birthto children with serious cerebral palsy. Hence, unbornfoetus, infant and young children are more sensitiveto such toxic effects.[4]
14. Acute toxicity is often a result of occupational exposure,and that from dietary exposure is rare. Acute effects include increased occurrenceof lymphocytic aneuploidy, discolouration of the frontsurface of lens of the eyes, insomnia, tremors andhyperexcitability.
15. There is a long latent period before early symptoms of methylmercurypoisoning including paraesthesia, malaise and blurredvision emerge. Constriction of the visual field, deafness,dysarthria and ataxia may develop at a later stage. The patient may partly recover from thesymptoms in a less severe case or may fall into acoma as a result in a severe case. Damages to the central nervous system are highlylocalized and affect mostly sensation, vision andhearing. [4]
16. The Joint FAO/WHO Expert Committee on Food Additives (JECFA)has established the PTWIs of 5 µg/ kg bw/weekfor total mercury and 3.3 µg/kg bw/week formethylmercury respectively. Since foetus and infants may be at greaterrisk of toxic effects, JECFA in July 2003 reducedthe PTWI for methylmercury to 1.6μg/kg bw/week and this level is considered sufficient to protect the developingfoetus, the most sensitive subgroup of the population.[6] [7]
17. PTWI is an estimate of the amount of a contaminant that canbe ingested over a lifetime without appreciable risk.
SCOPE OF STUDY
18. To estimate the dietary exposures to total mercury and methylmercury,this study covered six major food groups, namely (i)cereals and cereal products, (ii) vegetables, (iii)meat, poultry and their products, (iv) fish, (v) seafoodother than fish, and (vi) milk and dairy products. The other food sources, such as beverages,were not covered in this study as they were generallynot regarded as significant sources of mercury.
METHODOLOGY
Food Consumption Data
19. As in the previous study, the food consumption data in thisreport were extracted from the Food Consumption Surveyconducted on local secondary school students in 2000by the Department. Readers may refer to report of previousstudy1 and the Food Consumption Survey reportfor details. [2]
Sampling Plan for Food Samples
20. Food samples specific for the present study were taken fromthe local market according to the six food groupsas mentioned in para. 18. The food items in each food group wereselected so as to match those in the Food ConsumptionSurvey.
Laboratory Analysis
21. Laboratory analysis was done by the Food Research Laboratory(FRL) of FEHD and the analysis was conducted mainlyin form of "composite sample". Samples of the same food types were mixed andhomogenized. Fortotal mercury analysis, the food samples were digestedwith concentrated nitric acid and hydrogen peroxide,and the mercury content was determined by cold vapouratomic absorption spectrometry with amalgamation asa pre-concentration step. For methylmercury analysis, methylmercury inthe food sample was extracted by hydrochloric acidand derivatized with sodium tetraphenylborate, andwas analyzed by gas chromatography equipped with atomicemission detector. The LOD for total mercury and methylmercuryfor this study were 3μg/kg and 1μg/kg (calculated as mercury) respectively.
22. When the analytical value was below the LOD, the true valuecould be anywhere between zero and the LOD. The treatment for these results was particularlyimportant when a large percentage of the analyticalresults of a particular food group were below LOD.
23. While it may not be appropriate to assume a zero concentrationfor all the samples with analytical values below LOD,assigning the non-detects the value of LOD would,however, grossly overestimate the dietary intake. A value of 1/2-LOD was assigned to all resultsbelow LOD in this study. Since the levels of contaminants in food,including mercury, usually follows a log-normal distribution,assigning a value of 1/2 LOD to all non-detected levelsis considered as a conservative approach, especiallyfor food groups in which the majority of food itemshave levels below the LOD.
24. For non seafood samples, only those samples with analyticalvalues of total mercury above LOD were further subjectto methylmercury analysis since mercury in non seafooditems is largely in the inorganic form. For these samples, a value of 1/2-LOD formethylmercury was also assigned as a conservativeapproach.
Dietary Exposures to Total Mercury and Methylmercury
25. Dietary exposure from individual food item was obtained bycombining the consumption data and the median concentrationof individual food items. Total exposure for each student was obtainedby summing exposures from all food items. The mean of the exposures of all the studentswas used to represent the average dietary exposures. The 95th percentile of the exposurelevel was used to represent the exposure for highconsumers.
26. The daily dietary exposure was multiplied by seven to obtaina weekly exposure level of an average secondary schoolstudent.
27. The estimated weekly exposure level was then compared withthe PTWI as established by JECFA.
RESULTS
Concentration of Total Mercuryand Methylmercury
28. A total of 347 food samples were taken and combined into 115composite samples for analysis. The median concentrations for total mercuryand methylmercury for each food group are given inTable 1.
Table 1: Median Concentrations for Total Mercury andMethylmercury in Six Food Groups
| Food group | Total Mercury | Methylmercury | ||
|---|---|---|---|---|
| % of samples below LOD | >Median concentration (μg/kg) | >% of samples below LOD/ not analyzed | >Median concentration (μg/kg) | |
| Cereal and cereal products | 100.0 | 1.5 * | 100.0 | 0.5 * |
| Vegetables | 91.7 | 1.5 * | 100.0 | 0.5 * |
| Meat, poultry and theirproducts | 94.4 | 1.5 * | 100.0 | 0.5 * |
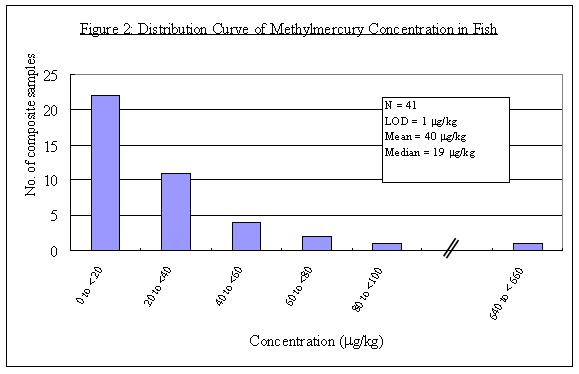
| Fish | 0 | 58 | 0 | 19 |
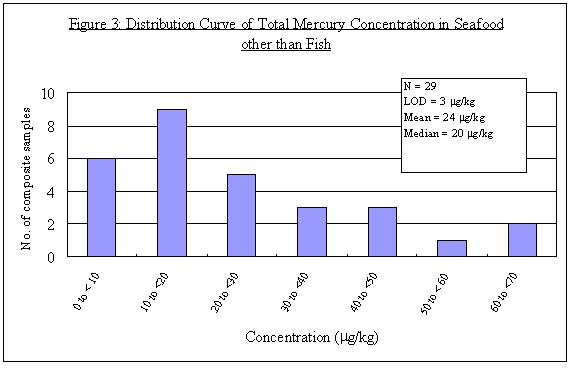
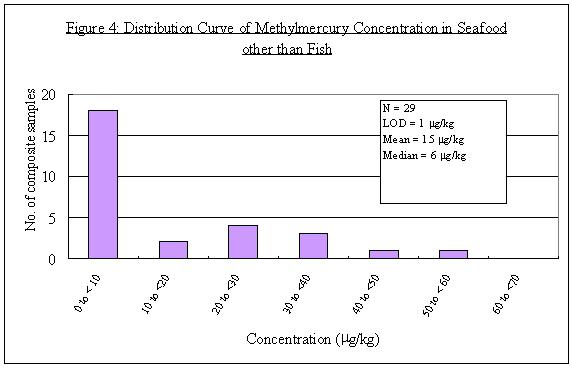
| Seafood other than fish | 0 | 20 | 0 | 6 |
| Milk and dairy products | 100.0 | 1.5 * | 100.0 | 0.5 * |
(* a value of 1/2 LOD wasassigned)
29. Total mercury and methylmercury were detected in all the samplesfrom the two food groups "fish" and "seafood otherthan fish". For the remaining food groups, only a fewsamples were found to contain low levels of totalmercury but none of them was found to contain methylmercury. Distribution curves of total mercury and methylmercuryconcentrations in the two food groups "fish" and "seafoodother than fish" are presented in Annex I.
Dietary Exposures to TotalMercury and Methylmercury
Average Secondary School Students
30. The estimated dietary exposures to total mercury and methylmercuryfor average secondary school students were obtainedfrom the mean exposure level. The dietary exposures for average secondaryschool students were 0.92 and 0.35μg/kg bw/week for total mercury andmethylmercury respectively. The results are shownin Table 2.
Table 2: Estimated Dietary Exposure to Total Mercuryand Methylmercury for Average Secondary School Students
| Food Group | Dietary Exposure in μg/kg bw/week (% contribution) | |
|---|---|---|
| Total Mercury | Methylmercury | |
| Cereals and cereal products | 0.10 (11%) | 0.03 (10%) |
| Vegetables | 0.07 (8%) | 0.02 (6%) |
| Meat, poultry and theirproducts | 0.04 (4%) | 0.01 (4%) |
| Fish | 0.54 (59%) | 0.21 (59%) |
| Seafood other than fish | 0.13 (14%) | 0.06 (18%) |
| Milk and dairy products | 0.03 (3%) | 0.01 (3%) |
| Total | 0.92 (100%)* | 0.35 (100%)* |
(* Figures may not add upto total due to rounding)
High Consumers
31. Further analyseswere undertaken to estimate the risk that high consumersmight be exposed to. The 95th percentile exposure levelof the secondary school students was used to representthe dietary exposure to total mercury and methylmercuryfor high consumers. The dietary exposures for high consumerswere 2.33 and 0.87μg/kg bw/week for total mercuryand methylmercury respectively. (Table 3)
Table 3: Comparison among PTWIs Established by JECFA,Dietary Exposures for Average Secondary School Students and High Consumers for Total Mercury and Methylmercury
| JECFA PTWI (μg/kg bw/week) | Exposure (μg/kg bw/week) (% of PTWI) |
||
|---|---|---|---|
| Average Secondary School Students | High Consumers | ||
| Total Mercury | 5 | 0.92 (18%) | 2.33 (47%) |
| Methylmercury | 1.6 | 0.35 (22%) | 0.87 (54%) |
DISCUSSION
32. For an average secondary school student, dietary exposuresto total mercury and methylmercury were 0.92 and 0.35μg/kg bw/week respectively. Theproportions of their respective PTWIs contributedby these exposures were 18% for total mercury and22% for methylmercury. The exposures were well below the respectivePTWIs established by JECFA for both total mercuryand methylmercury.
33. For high consumers, the dietary exposures to total mercuryand methylmercury were 2.33μg/kg bw/week (47% of PTWI)and 0.87μg/kg bw/week (54% of PTWI). Exposures to total mercury and methylmercuryfor high consumers were also below their respectivePTWIs.
34. Therefore, the dietary exposure estimates of our results suggestedthat secondary school students for both average andhigh consumers were unlikely to experience major undesirablehealth effects to total mercury and methylmercury.
35. In our findings, the main dietary source of total mercury andmethylmercury was "fish" which contributed 59% ofboth total mercury and methylmercury exposures. This is followed by the food group "seafoodother than fish" (14% of total mercury and 18% ofmethylmercury exposures respectively). The findings are consistent with those conductedin overseas dietary exposures studies such as thoseconducted in the US, UK and Australia.[8][9] [10]However, this differs from the results of our previousstudy which had overestimated the contribution ofcereal and cereal products because of the limitationof the study and had therefore identified cereal andcereal products as the main contributor (34%) of dietarymercury.
36. The laboratory analysis used in the present study with a lowerdetection limit as compared with the previous studyprovided a more precise estimation of the dietaryexposure pattern. In the previous study, the LOD for totalmercury was 30μg/kg while in the present study, theLOD for total mercury was 3μg/kg and that for methylmercurywas 1μg/kg. Even with the low LOD, most of the resultsin the non-seafood food groups were still below LOD. Because of the approach to assign 1/2 LODinstead of assigning zero to levels below LOD, theexposure estimate from individual non-seafood foodgroups or food items would be directly proportionalto the LOD.
37. Because of the relatively high amount of consumption, "cerealand cereal products" was still estimated to contribute11% for total mercury and 10% for methylmercury exposuresrespectively.
38. The majority of non-seafood items have total mercury levelsbelow LOD. Onlythose non-seafood samples with detectable levels oftotal mercury were further analyzed for methylmercury. For non-seafood samples with total mercurylevel below LOD, a value of 1/2 LOD for both totalmercury and methylmercury was assigned to these samples. Since it is expected that mercury in foodother than seafood is largely in the inorganic form8, this conservative approach would attributeto an overestimation of the methylmercury exposurefrom these food groups. When a methylmercury level of zero is assignedfor non-seafood samples with non-detected total mercury,the dietary exposure to methylmercury for averageand high consumers would become 0.27 and 0.76μg/kg bw/week respectivelyand the contributions of food groups "fish" and "seafoodother than fish" would become 76% and 23% respectively.
39. Among the six food groups, "fish" has the highest levels ofboth total mercury and methylmercuy, and this is followedby "seafood other than fish". Of the food items analysed, large predatoryfish such as swordfish and tuna had the highest levelof mercury. Thisfinding is similar to those obtained in our previousstudy and in overseas studies.[11][12] The percentages of total mercurybeing methylmercury in "fish" ranged from 18% to 96%with a median of 40% and that in "seafood other thanfish" ranged from 13% to 95% with a median of 49%.
40. Estimates of dietary exposure to total mercury were comparedwith findings in overseas studies and presented inTable 4. However, direct comparison of the datahas to be done with caution due to the differencesin research methodology, food group categorization,methods of collection of consumption data, methodsof contaminant analysis and methods of treating resultsbelow detection limits. The dietary exposure estimated in our studyis comparable to exposure patterns obtained from overseasstudies.
Table 4: A Comparison of Average Weekly Exposure of Total Mercury
| Country | Average Weekly Dietary Exposure (μg/person/week) |
|---|---|
| USA | 8.75 |
| Netherlands | 14 |
| UK | 21.7 |
| Hong Kong | 47.8 * |
| New Zealand | 51 |
| Japan | 72 |
| China | 72.1 |
| Australia | 26-126 |
| Spain | 129 |
# Data contained in this table is extracted from the report on "DietaryExposure to Heavy Metals of Secondary School Students"published by FEHD in 2002.
* The exposure data in Hong Kong is calculated by multiplyingthe dietary exposure for average secondary schoolstudents and mean body weight (i.e. 0.92μg/kg bw/week X 52.0kg).
41. JECFA has established a PTWI of 1.6μg/kg bw/week for methylmercury for protection of the developing foetus,the most sensitive subgroup of the population. Since the data of consumption pattern forpregnant women is not available, the health risk ofmethylmercury resulting from dietary exposure of pregnantwomen can not be assessed. However, the 95th percentileexposure level obtained in our study (0.87µg/kgbw/week) is still below this PTWI.
Limitation
42. The methodology for collection of food consumption data mayinfluence the accuracy of the estimates on dietaryexposure. In the Food Consumption Survey, the foodconsumption pattern of secondary school students wascollected using a food frequency questionnaire. Although the food frequency questionnaire wasvery comprehensive, it was not possible to cover everysingle food item, some of which might be relevantto mercury exposure. For example, the consumption pattern of individualseafood species is not known and thus the dietaryexposure from seafood products was estimated fromthe consumption of food groups "fish" and "seafoodother than fish".
CONCLUSIONS AND RECOMMENDATIONS
43. The dietary exposures to total mercury and methylmercury foraverage secondary school students were 0.92 and 0.35μg/kg bw/week respectively and that for high consumers were 2.33 and 0.87μg/kg bw/week respectively. They are all within their respective PTWIsestablished by JECFA. It can be concluded that both the average andhigh consumers among secondary school students wouldbe unlikely to experience major toxicological effectsof total mercury and methylmercury.
44. The food group "fish" was identified as the main dietary sourceof total mercury and methylmercury. The large predatory fish such as swordfishand tuna had the highest concentration of mercuryand they may be significant dietary sources of mercuryespecially when they are consumed in large amount.
45. A balanced diet is essential to avoid excessive exposure tomercury from a small range of food items.
46. Susceptive groups such as children and pregnant women shouldbe careful in the selection of food, in particular,they are advised not to consume excessive amount predatoryfish such as swordfish and tuna. While fish is a good source of high-qualityprotein and low in saturated fat, moderate consumptionof fish is recommended.
ANNEXI - Distribution Curves of Total Mercury and MethylmercuryConcentrations in Fish and Seafood other than Fish

REFERENCES
[1]FEHD. Dietary Exposure to Heavy Metals of SecondarySchool Students. Hong Kong: FEHD; 2002.
[2]FEHD. Food Consumption Survey 2000. Hong Kong:FEHD; 2001.
[3]Eisler R. Handbook of Chemical Risk Assessment - Health Hazards to Humans, Plants and Animals.Vol.1 - Metals. US: Lewis Publishers; 2000.
[4]World Health Organization (WHO). Methylmercury.Environmental Health Criteria 101. Geneva: WHO;1990. Available from: http://www.inchem.org/documents/ehc/ehc/ehc101.htm
[5]Committee on the Toxicological Effects of Methylmercury,National Research Council. Toxicological Effectsof Methylmercury. US: National Academy Press;2000.
[6]WHO. Summary and conclusions of the 61st meetingof JECFA. Geneva: WHO; 2003: 18-22
[7]WHO. UN Committee recommends new dietary intakelimits for mercury. Geneva: WHO; 2003. Availablefrom: http://www.who.int/mediacentre/notes/2003/np20/en
[8]Egan SK, Tao SSH, Pennington JAT, Bolger PM.US Food and Drug Administration's Total DietStudy: intake of nutritional and toxic elements,1991-96. Food Additives and Contaminants 2002;19(2):103-25.
[9]Ministry of Agriculture, Fisheries and Food(MAFF) of UK. Total diet study - Aluminium,Arsenic, Cadmium, Chromium, Copper, Lead, Mercury,Nickel, Selenium, Tin and Zinc. Food SurveillanceInformation Sheet No.191. UK: MAFF; 1999. Availablefrom: http://archive.food.gov.uk/maff/archive/food/infsheet/1999/no191/191tds.htm
[10]Australia New Zealand Food Authority (ANZFA).The 19th Australian Total Diet Survey. Australiaand New Zealand: ANZFA; 2001.
[11]US Food and Drugs Administration (FDA). FDAAnnounces Advisory on Methylmercury in Fish.FDA Talk Paper. US: FDA; 2001. Available from:http://www.cfsan.fda.gov/~lrd/tphgfish.html
[12]Canadian Food Inspection Agency (CFIA). Mercuryand Fish Consumption. Consumer Fact Sheet. Canada:CFIA; 1999. Available from: http://www.inspection.gc.ca/english/corpaffr/foodfacts/mercurye.shtml