Risk Assessment Studies
Report No. 28
NUTRIENT VALUES OF
FRUIT AND VEGETABLES
June 2007
Centre for Food Safety
Food and Environmental Hygiene Department
The Government of the Hong Kong Special Administrative Region
Correspondence:
Risk Assessment Section
Centre for Food Safety
Food and Environmental Hygiene Department
43/F, Queensway Government Offices,
66 Queensway, Hong Kong
Email: enquiries@fehd.gov.hk
Table of contents
| Table of contents | Page |
|---|---|
| Abstract | 2 |
| Objectives | 3 |
| Background | 3 |
| Scope of Study | 5 |
| Method | 5 |
| Result and Discussion Amount of nutrients in fruit and vegetables sampled |
6 |
| Conclusion and Recommendations Advice to consumers Advice for the trade |
19 |
| References | 22 |
| Annex | 23 |
Risk Assessment Studies
Report No. 28
NUTRIENT VALUES OF
FRUIT AND VEGETABLES
ABSTRACT
The Centre for Food Safety (CFS) has conducted a study to determine the nutrient values of fruit and vegetables.
The report presents the nutrient content information of 82 types of fruit and vegetables. Laboratory analyses for energy and ten nutrients of local public health interest were conducted by the Food Research Laboratory of CFS for 49 samples. Nutrient data of 33 fruit and vegetables items from overseas database were also included and compared.
The results showed that fruit and vegetables were good sources of dietary fibre and vitamin C in our diet, whilst their energy value and fat contents were generally low. However, the content of these nutrients could be affected by cooking and preparation methods.
Members of the public are recommended to consume at least 2 servings of fruit and 3 servings of vegetables daily as part of a balanced diet. When choosing and preparing fruit and vegetables, patrons are recommended to choose a wide variety of fresh fruit and vegetables and limit the amount of added sauce and oil. Patrons wishing to maximize the fibre intake from fruit are advised to consume fruit with their edible peels.
Food trade is advised to provide more fruit and vegetables items in food premises, such as providing more vegetable dishes; adding vegetables to meat dishes; including fruit and/or vegetables in the set menus; and replacing desserts with cut fruits.
Nutrient Values of Fruit and Vegetables
OBJECTIVES
This study aims to determine the nutrient values of the common local fruit and vegetables, and to examine the change in nutrient values of fruit and vegetables after certain food preparation processes.
BACKGROUND
2. Food is essential to human life because it is the source of energy and nutrients. Eating the right amount of different kinds of food is the key to a balanced diet and optimal nutrition. Many chronic diseases such as coronary heart disease, diabetes and certain types of cancer are related to imbalanced diet. These nutrition-related diseases are important public health problems in many parts of the world including Hong Kong.
3. Knowing the nutrient contents of food is crucial for making healthy food choices. To establish a database of nutrient composition of local food items, the Food Research Laboratory (FRL) has started conducting nutrient analysis of indigenous foods since 2002. The latest study on the nutrient values of indigenous congee, rice and noodle dishes was completed and released in March 2006.
4. In recent years, extensive studies have been conducted on fruit and vegetables regarding their essential role in healthy eating and their capacity to decrease our risks of disease such as heart disease, stroke and certain cancers. Fruit and vegetables provide essential vitamins and minerals, dietary fibre, and other substances that are important for maintenance of good health.
5. Nevertheless, there has been no systematic nutrient analysis of fruit and vegetables commonly found in Hong Kong. To fill in this gap, the Centre for Food Safety (CFS) initiated a study on the nutrient composition of fruit and vegetables that are commonly available locally.
Fruit and vegetables
6. There is a wide range of fruit and vegetables available in Hong Kong. The nutrient contents of the fruit and vegetables vary, and can change significantly after preparation such as boiling, stir-frying and peeling.
7. In the "Behavioural Risk Factor Survey" conducted by the Department of Health (DH) in April 2006, 44.6% of respondents consumed less than one portion of fruit per day and 29.8% of them ate less than one bowl of vegetables daily. 77.6% respondents consumed less than 5 portions of fruit and vegetables per day, which was the recommended daily intake.1
Nutrition and noncommunicable diseases
8. Nutrition is one of the major lifestyle risk factors related to development of noncommunicable diseases (NCDs). Unhealthy diets, together with physical inactivity, are among the leading causes of NCDs, including cardiovascular disease and certain types of cancer. Fruit and vegetables are important components of a healthy diet. Accumulating evidence suggests that they could help prevent major diseases such as cardiovascular diseases and certain cancers principally of the digestive system. Low intake of fruit and vegetables is estimated to cause about 19% of gastrointestinal cancer, and about 31% of ischaemic heart disease and 11% of stroke worldwide. 2 In 2002, the World Health Organization (WHO) estimated that 2.7 million (4.9%) deaths and 26.7 million (1.8%) Disability Adjusted Life Years (DALYs)* were attributable to low fruit and vegetable intake globally. Of the burden attributable to low fruit and vegetables intake, about 85% was from cardiovascular diseases and 15% from cancers.2
9. WHO recommended individuals to consume 400g (~10 taels) or more fruit and vegetables per day to protect against obesity and cardiovascular diseases. One of the functional components of fruit and vegetables is dietary fibre. WHO recommended a population intake goal of 25g per day for dietary fibre to substantially reduce the risks of many chronic diseases.3 Besides, a set of population nutrient intakes was proposed by the WHO and Food and Agriculture Organization of the United Nations (FAO) as a part of recommendation for prevention of chronic diseases (Annex I).
10. In order to promote the health of the population, the DH has launched the "2 plus 3" programme to promote fruit and vegetables intakes and recommends a daily intake of at least 2 servings of fruit and 3 servings of vegetables as part of a balanced diet. One serving of fruit is approximately equivalent to one piece of medium-size fruit, 1/2 cup cut-up fruits or berries, or 3/4 cup fresh fruit juices; while one serving of vegetables is approximately equivalent to 1 bowl of raw leafy vegetables, 1/2 bowl of cooked vegetables, or 3/4 cup fresh vegetable juice.4
SCOPE OF STUDY
11. This study covered the common fruit and vegetables sold on the local market. A total of 49 fruit and vegetables items were sampled for chemical analysis. Changes in nutrient contents after different food preparation methods were also studied for 16 selected fruit and vegetables (Annex II). Apart from the results of chemical nutrient analysis conducted by FRL, the nutrient data of 33 fruit and vegetables and 5 sauces from the Standard Reference 19 (SR19) of the Nutrient Data Laboratory (NDL) of US Department of Agriculture (USDA) 5 and 3 sauces from the previous study of Chinese dim sum of the Department 6 were included in the data analysis of this study.
METHOD
Sampling
12. The food samples were purchased and analyzed from September 2005 to September 2006. For each vegetable item, 10 food samples (2 catties each) were randomly purchased from Cheung Sha Wan Wholesale Vegetable Market of Vegetable Market Organization (VMO). For each fruit item, 10 food samples (1 kg each) were purchased from the fruit wholesales market in Yau Ma Tei. For each fresh fruit juice item, 10 food samples were randomly purchased from the food outlets in Hong Kong.
13. For the 16 food items that were tested for changes in nutrient contents after food preparation, two or more sets of samples were purchased. One set of samples was tested in raw state, and the other set(s) of samples were processed as stated in Annex II in the laboratory before analysis.
Laboratory Analysis
14. The laboratory testing work was conducted by the FRL of the CFS. For each food sample, the edible portion was obtained and homogenized. Appropriate test portions were taken for determining the nutrient profile by chemical analysis. All tests were conducted using single-laboratory validated methods based on international standards. A brief description of the test methods are shown in Annex III.
Data Analysis
15. The nutrient contents of the vegetables and fruit were presented in per 100 g basis. For each nutrient, the mean value is reported and corrected to two significant figures. If the level of a nutrient is too low for reliable reporting, the term "trace" is indicated (refer to Annex IV for details). The term "not determined" refers to cases where by nature of the food items, testing for nutrient parameters is not appropriate and/or the nutrient is considered not generally present at a significant level.
RESULTS AND DISCUSSION
16. In this study, nutrient contents of 49 fruit and vegetables were examined. The value of energy, carbohydrate, total fat, protein, saturated fat, cholesterol, sugar, dietary fibre, calcium, sodium and vitamin C per 100 g of the samples are presented in Annex V. In addition to these 49 samples, 33 other fruit and vegetables items were selected from the USDA database for comparison and analysis. Their nutrient contents were also listed in Annex V.
Amount of nutrients in fruit and vegetables sampled
17. Fruit and vegetables are good sources of dietary fibre and vitamin C. In general, their energy values are low. Cholesterol is absent in fruit and vegetable, while their sodium content is low.
Fruit
Dietary fibre
18. Fruit is an important source of dietary fibre in our diet. The dietary fibre content of 100g fruit in the list ranged from 0.4g to 6.7g, with a mean of 2.3g. Avocado, guavas, durian, kiwi fruit and western pear were fruits with highest fibre content in our list. (Figure 1).
Figure 1. Dietary fibre content of fruits (g/100g)
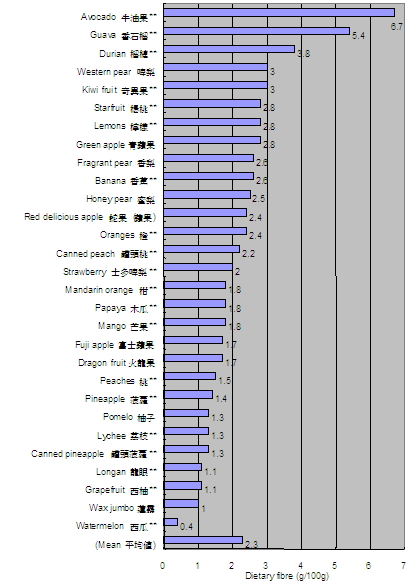
** Data from USDA SR19
Figure 2. Percentage loss of dietary fibre after peeling of selected fruit 
20. The nutrient contents of one serving of orange, watermelon, mango and pear (1/2 cup or one medium size fruit) and their fresh juice (3/4 cup, or 180ml per serving) were also compared. Dietary fibre was absent in the fruit juices tested.
Vitamin C
21. Fruit is an important source of vitamin C. The vitamin C content of 100g fruit and vegetables in the list ranged from 2mg to 228.3mg, with a mean of 39 mg. Guava, black currant, kiwi fruit, longan, and lychee are fruits rich in vitamin C (Figure 3).
Figure 3. Vitamin C content of different types of fruit (mg/ 100g ) 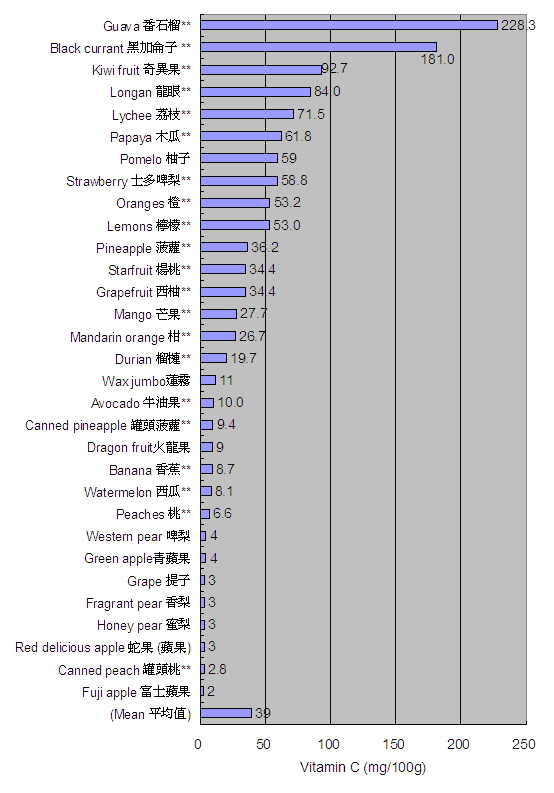
** Data from USDA SR19
Energy
22. Fruits are generally regarded as low-energy food. The mean energy value of fruits listed in Figure 4 was 60 kcal per 100g. Fruit high in fat or sugar usually have higher energy value.
23. Although most fruits are low in fat, avocado and durian are two of the exceptions. 100g of avocado and durian contains 14.66g and 5.33g of fat respectively. The energy values of the fruits are also high, that is, 160 kcal per 100g avocado and 147 kcal per 100g durian.
24. Sugar content is generally higher in fruit than vegetables. Lychee, mango and grapes are examples of fruit with high sugar content. Canned fruits have higher sugar levels than fresh fruits. The energy values of these high-sugar fruit were found to be generally higher than other fruit (Figure 4).
25. When comparing one serving of orange, watermelon, mango and pear (1/2 cup or one medium size fruit/vegetable) and their fresh juice (3/4 cup, or 180ml per serving), it was found that the sugar content in juices was 9% to 103% higher than the corresponding fruit. This contributed to energy value of 16% to 119% higher in juices than in the corresponding fruits.
Vegetable
Dietary fibre
26. Similar to fruit, vegetables are also an important source of dietary fibre in our diet. The dietary fibre content of 100g vegetables in the list ranged from 0.5g to 4.9g, with a mean of 1.9g. Lotus root, garland chrysanthemum (茼蒿), Chinese chives (flower stalks), carrot and broccoli were found to have higher dietary fibre content (Figure 5).
Figure 4. Sugar and energy content of different types of fruit
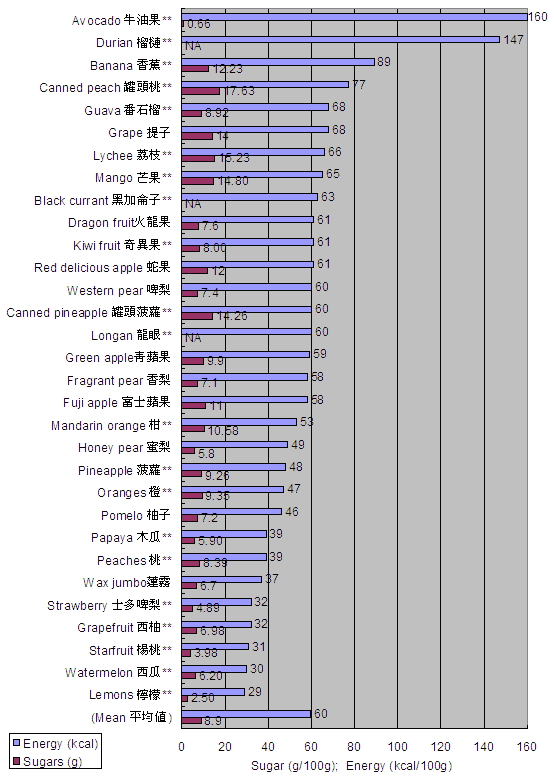
** Data from USDA SR19; NA: Data not available
Figure 5. Dietary fibre content of different types of vegetables (g/100g)
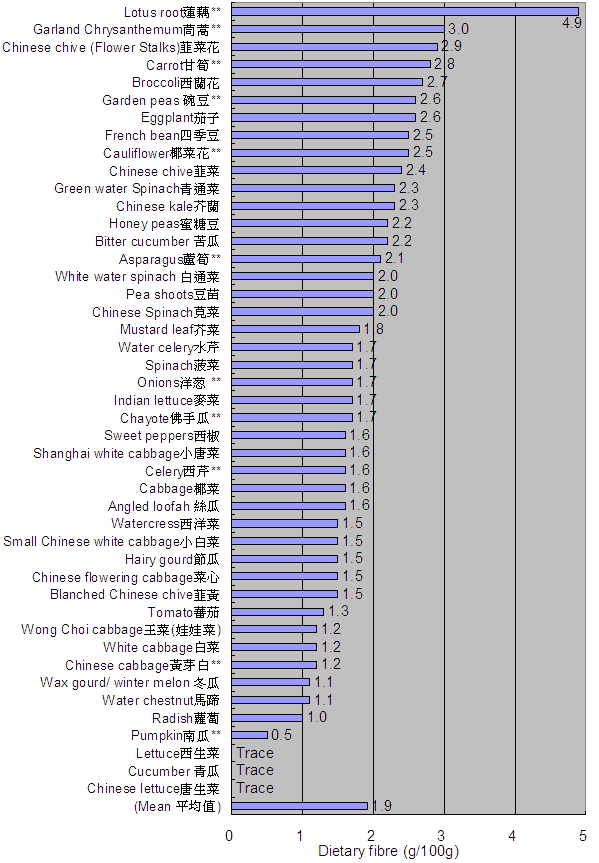
** Data from USDA SR19
27. The dietary fibre content of vegetables could be affected by preparatory methods. For example, peeling the skin of angled loofah resulted in a loss of 38% of dietary fibre.
28. Some people consume vegetables, such as Chinese kale and Chinese flowering cabbage, with the leaves removed. It was found that the dietary fibre contents of the leaves and stalks of Chinese flowering cabbage were similar, while the leaves of Chinese kale contained slightly higher dietary fibre (4.5%) than the stalks. However, the leaves of these vegetables had at least three times as much calcium as that in the stalks.
Vitamin C
29. Vegetables are a good source of vitamin C. The vitamin C content of 100g vegetables in the list (Figure 6) ranged from 1.4mg to 120mg, with a mean of 26mg. Bitter cucumber (苦瓜), broccoli, mustard leaf, Chinese kale and pea shoots have the highest vitamin C content among vegetables in the list.
30. Vitamin C is easily destroyed by heat. The effect of different cooking methods on the vitamin C content of selected vegetables was studied (Figure 7). The amount of vitamin C content depended on the type of vegetables as well as the cooking methods. Concerning the cooking methods, while stir-frying and boiling are two of the most commonly used methods for cooking vegetables, less vitamin C was lost by stir-frying vegetables than boiling them. As vitamin C is water soluble, some vitamin C might be lost in the water used to boil the vegetables. Although stir-frying reduced the vitamin C content of vegetables to a lesser extent compared with boiling, it would increase the fat content of the vegetables.
Figure 6. Vitamin C content of different types of vegetables (mg/ 100g ) 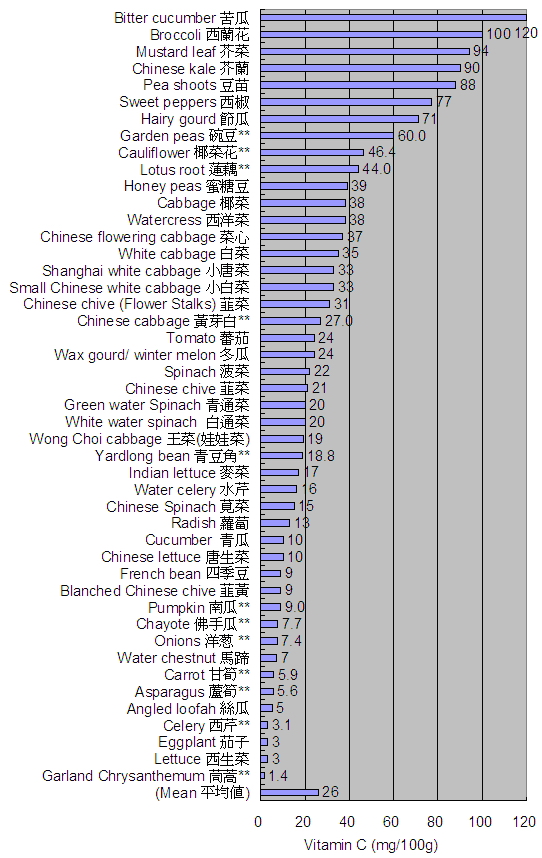
** Data from USDA SR19
Figure 7. Effect of different cooking methods on the vitamin C content of selected vegetables (mg/ 100g)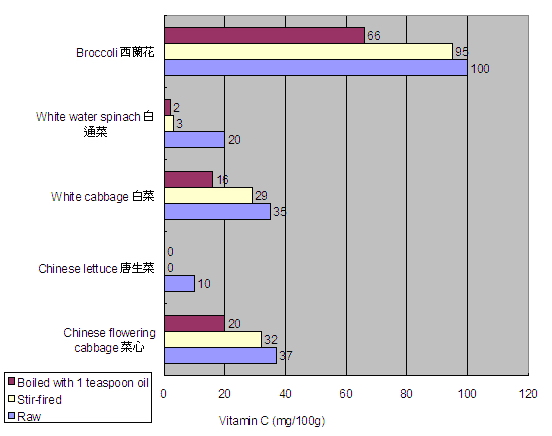
Energy
31. Similar to fruit, vegetables have low energy value. The energy value of vegetables ranged from 8.4 kcal to 74 kcal per 100g, with a mean of only 26 kcal per 100g (Figure 8). However, the energy value of vegetables could greatly increase when fat and oil was added in the process of cooking and seasoning.
32. The fat content of cooked vegetables varied greatly with the cooking methods. From the study, it was found that cooking vegetables by steaming or boiling without oil contributed very little or no change to the fat content of the vegetables. However, when the vegetables were boiled with oil or stir-fried, there was a 0.3 to 7.4 g increase in the fat content per 100 g (or around 1.8 to 44.8 g increase per catty *) compared to those boiled without oil (Figure 9). By calculation, the increased fat content accounted for an extra 3 to 67 kcal energy per 100 g vegetables. On average, it was found that boiling vegetables in 1 teaspoon oil and 1 tablespoon oil increased the fat content by 1.2 times and 3.1 times respectively, whereas stir-frying increased the fat content by 19.3 times. Usually, more oil is used in stir-frying food than in boiling. Addition of oil to vegetables during cooking can greatly increase the fat content.
*1 catty = 605 g
Figure 8. Energy value of different types of vegetables (g/100g)
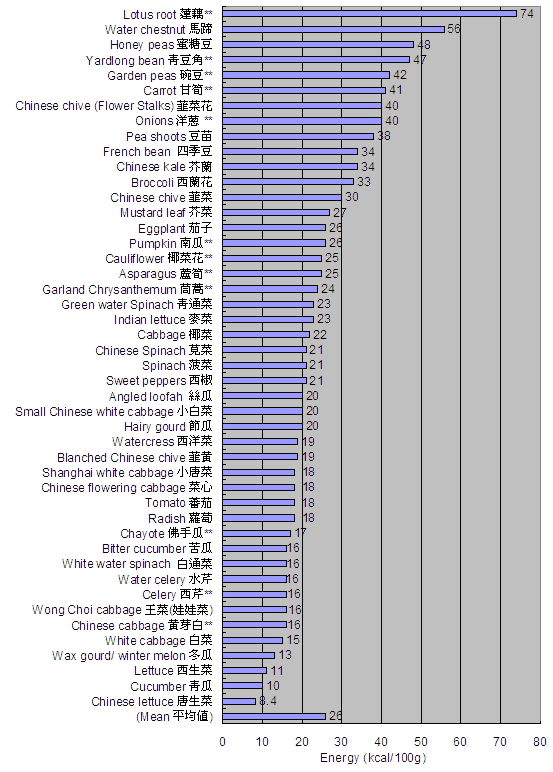
** Data from USDA SR19
Figure 9. Effect of different cooking methods on the fat content of selected vegetables (g/ 100 g ) 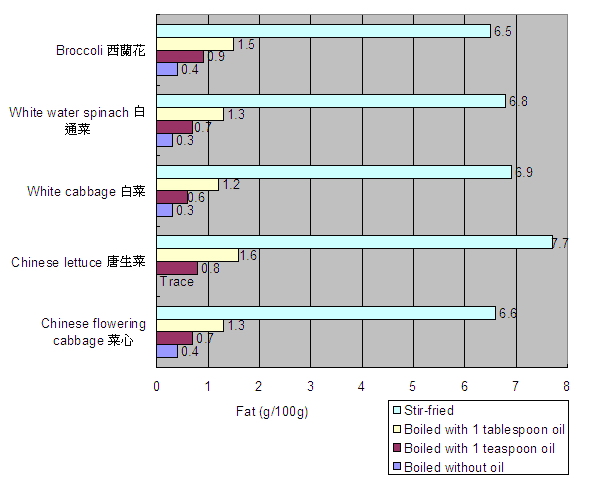
33. In this study, the effect of adding sauces on the total fat content of boiled or salad vegetables was investigated. Salad vegetables such as lettuce and broccoli were commonly consumed with dressings such as thousand island dressing, French dressing, Caesar dressing and mayonnaise. Addition of one tablespoon of these dressings to a serving (1 bowl) of salad vegetables, for example, can increase the fat content by about 5-8 g per serving (Figure 10). On the other hand, it was found that adding soy sauce, sweet soy sauce, oyster sauce or fermented soy beancurd sauce to boiled vegetables made very limited change to their total fat content. However, addition of these sauces may increase the sodium content of the vegetables. The effect of adding different sauces to boiled vegetables in terms of their sodium content has been reported in the previous study of Chinese Dim Sum of the Department (Report available from CFS's website at: http://www.cfs.gov.hk/english/programme/ programme_rafs/programme_rafs_n_01_03_ra_dim_sum.html).
Figure 10. Increase in fat content after addition of 1 tablespoon dressing to vegetables (g/serving) 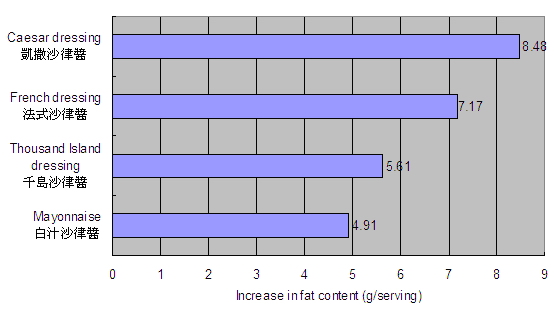
WHO recommendation
34. The WHO recommended a daily intake of no less than 400g fruit and vegetables, excluding tubers such as potato and taro. Table 1 shows some combinations of 2 servings of fruit and 3 servings of vegetables, which meet the WHO recommendation for fruit and vegetables consumption. This suggested that following the "2 plus 3" guidelines from the DH would be able to achieve the recommended fruit and vegetables intake by the WHO.
Limitation of the study
35. A large variety of fruit and vegetables is available in Hong Kong. This study included some of the fruit and vegetables commonly found on the market. There were still a number of fruit and vegetables not being covered.
36. The nutrient content of fruit and vegetables varies across different seasons, as well as growing locations and conditions. It also depends on the ripeness of the fruit and vegetables.
Table 1 Total weight of fruit and vegetables combinations
| serving | weight (g) | |
|---|---|---|
| Red delicious apple 蛇果 ( 蘋果 ) | 1 medium | 138 |
| Western pear 啤梨 | 1 medium | 178 |
| Chinese flowering cabbage (cooked) 菜心 ( 熟 ) | 1/2 bowl | 65 |
| White water spinach (cooked) 白通菜 ( 熟 ) | 1/2 bowl | 66 |
| Eggplant (cooked) 茄子 ( 熟 ) | 1/2 bowl | 50 |
Total |
2 +3 * |
497 |
| Dragon fruit 火龍果 | 1/2 medium | 175 |
| Pomelo 柚子 | 2 sections | 122 |
| Lettuce (raw) 西生菜 ( 生 ) | 1 bowl | 72 |
| Broccoli (cooked) 西蘭花 ( 熟 ) | 1/2 bowl | 78 |
| Sweet peppers (cooked) 西椒 ( 熟 ) | 1/2 bowl slices | 57 |
Total |
2 +3 |
504 |
| Grapes 提子 | 1/2 cup | 75 |
| Orange 橙 | 1 medium | 131 |
| White cabbage (cooked) 白菜 ( 熟 ) | 1/2 bowl | 85 |
| Hairy gourd (cooked) 節瓜 ( 熟 ) | 1/2 bowl | 90 |
| Tomato (Cooked) 蕃茄 ( 熟 ) | 1/2 bowl | 120 |
Total |
2 +3 |
501 |
* 2 +3: 2 servings of fruit plus 3 servings of vegetables
37. Besides cooking method, the nutrient contents of vegetables may also be affected by the cooking duration. However, this effect has not been examined in the study.
38. The nutrient composition of fruit and vegetables was evaluated in this study. Owing to the lack of comprehensive food consumption data in Hong Kong , the nutrient intake of the whole population and population subgroups from fruit and vegetables could not be quantified.
CONCLUSION AND RECOMMENDATIONS
39. This study provided data on the nutrient content of fruit and vegetables. The result of the study suggested that fruit and vegetables are good sources of dietary fibre and vitamin C, whilst their energy, total fat, saturated fat and sodium contents are generally low. They are also free from cholesterol.
40. Some fruits have higher energy value, for example, avocado and durian. Therefore, although avocado and durian are high in fibre, their consumption should be limited.
41. The leaves of Chinese kale and Chinese flowering cabbage contained more calcium than the stalks. Disposal of leaves during preparation is not advisable to those who want to maximize their calcium intake.
42. Addition of oil and dressings to fruit and vegetables during cooking and seasoning increases their fat content and energy value.
Advice to consumers
43. Consumption of adequate fruit and vegetables as part of the daily diet could help prevent major noncommunicable diseases such as cardiovascular diseases and certain cancers. Eating a variety of fruit and vegetables contributes to an adequate intake of dietary fibre and micronutrients. Increased fruit and vegetable consumption can also help displace foods high in saturated fats, sugar or salt.
44. In order to obtain the natural benefit from fruit and vegetables, daily consumption of no less than 400g fruit and vegetables is recommended. This could be achieved by following the "2 plus 3" recommendation from the DH—consuming 2 servings of fruit and 3 servings of vegetables daily. To increase the daily consumption of fruit and vegetables, patrons could -
(a) Include at least two kinds of vegetables as main dishes if possible, especially when dishes are shared among friends and family;
(b) Develop a habit of eating a serving of fruits after lunch and dinner, which can be done by replacing desserts with fresh fruits after meals;
(c) Choose crispy vegetables or non-sweetened dried fruits as snacks between meals instead of chips and candies;
(d) Replace sweetened beverages with fresh fruit juices, especially those with pulp; and
(e) Make sure that at least one-third of the lunch box is filled with vegetables.
45. When choosing and preparing fruit and vegetables, it is recommended to-
(a) Choose a wide variety of fruit and vegetables with different colours since they offer different nutrients;
(b) Consume fresh fruit and vegetables instead of juices and canned products whenever possible;
(c) Limit the amount of sauce added to fruit and vegetables as well as the oil used in cooking vegetables to reduce extra fat and sodium intake;
(d) Consume fruit with their edible peels for patrons who want to increase their fibre intake. Be sure to wash the fruit and vegetables thoroughly before eating.
Advice for the trade
46. Members of the trade were advised to provide more fruit and vegetables items in the food premises. This could be achieved by:
(a) Providing more vegetable dishes
(b) Adding vegetables to meat dishes
(c) Including fruit and/or vegetables in the set menus, and
(d) Replacing dessert with cut fruits.
47. For boiled vegetables and salads, it is recommended to serve the sauces separately to allow customers a free choice of amount of sauces desired for their vegetables and salads.
Prepared by Risk Assessment Section
Centre for Food Safety
Food and Environmental Hygiene Department
June 2007
References
- Department of Health. Behavioural risk factor study (April 2006) main report. Available at: URL: http://www.chp.gov.hk/files/pdf/grp_BRFS_2006(Apr)_tc.pdf
- WHO. World health report 2002. World Health Organization. Available at: URL:
http://www.who.int/whr/2002/chapter4/en/index4.html - FAO/WHO. Joint WHO/FAO Expert consultation on diet, nutrition and the prevention of chronic diseases. Geneva : WHO, 2003.
- Department of Health. Two plus three every day. Available at: URL:
http://2plus3.cheu.gov.hk/html/eng/index.asp?fname=index.aspx - U.S. Department of Agriculture, Agricultural Research Service 2004. USDA Nutrient Database for Standard References, Release 19. Nutrient Data Laboratory Home Page. Available at: URL: http://www.nal.usda.gov/fnic/foodcomp/search/
- Food and Environmental Hygiene Department. Risk assessment studies report No. 17. Nutrient values of Chinese dim sum. Hong Kong : Food and Environmental Hygiene department. Available at: URL:
http://www.cfs.gov.hk/english/programme/programme_rafs/programme_rafs_n_01_03_ra_dim_sum.html
Recommendations of WHO and FAO on Nutrient Intakes
In 2003, WHO and FAO updated the technical report entitled "Diet, nutrition and the prevention of chronic diseases" 1. In this report, a series of population nutrient intake goals for preventing diet-related chronic disease was established, and they are presented in Table 1.
Table 1 Ranges of population nutrient intake goals established by FAO/WHO
| Total fat | 15-30% of total daily energy intake |
|---|---|
|
Saturated fatty acids |
< 10% of total daily energy intake |
|
Polyunsaturated fatty acids (PUFAs) |
6-10% of total daily energy intake |
|
Trans fatty acids |
<1% of total daily energy intake |
|
Monounsaturated fatty acid |
By difference # |
|
Total carbohydrate |
55-75% of total daily energy intake |
|
Protein |
10-15% of total daily energy intake |
|
Cholesterol |
< 300 mg/day |
|
Sodium chloride (sodium) |
< 5 g/day (< 2 g/day) |
|
Fruit and vegetable |
3 400 g/day |
|
Total dietary fibre |
>25 g/day |
# This is calculated as: total fat – (saturated fatty acids + polyunsaturated fatty acids + trans fatty acids)
(Source: FAO/WHO, 2003 1)
The population nutrient intake goals were set up for consideration by national and regional bodies establishing dietary recommendations for the prevention of diet-related chronic diseases. It represents the population average intake that is judged to be consistent with the maintenance of a low prevalence of diet-related diseases in a population. 1 If existing population averages fall outside this range, or trends in intake suggest that the population average will move outside the range, health concerns are likely to arise.
However, no population nutrient intake goal for calcium and vitamin C was established by FAO/WHO in this report. In another report of a joint FAO/WHO expert consultation entitled "Human vitamin and mineral requirements" 2, the data of balanced studies and factors affecting the calcium and vitamin C requirement of human were reviewed. Based on the available data, the experts of FAO/WHO agreed to set the recommended calcium allowance of 1000 mg/day and vitamin C intake of 45 mg for adults. 2 The recommended calcium allowances of individuals in developed countries at different stages of life cycle were shown in Table 2, and the recommended vitamin C intake for different population groups were shown in Table 3.
Table 2 Recommended calcium allowance (daily) of individuals in developed countries established by FAO/WHO
| Group | Recommended intake mg/day |
|---|---|
|
0-6 months, human breast milk |
300 |
|
0-6 months, cow milk |
400 |
|
7-12 months |
400 |
|
1-3 years |
500 |
|
4-6 years |
600 |
|
7-9 years |
700 |
|
Adolescents, 10-18 years |
1300 1 |
|
Female adults, 19 years to menopause |
1000 |
|
Female adults, postmenopausal |
1300 |
|
Male adults, 19-65 years |
1000 |
|
Male adults, >65 years |
1300 |
|
Pregnancy (last trimester) |
1200 |
|
Lactation |
1000 |
1 Particularly during growth spurt
Table 3 Recommended nutrient intakes (RNIs) for vitamin C
| Group | RNI mg/day |
|---|---|
|
Infants and children, 0-6 months |
25 |
|
Infants and children, 7-12 months |
30 |
|
Infants and children, 1-3 years |
30 |
|
Infants and children, 4-6 years |
30 |
|
Infants and children, 7-9 years |
35 |
|
Adolescents, 10-18 years |
40 |
|
Adults, 19-65 years |
45 |
|
Adults, 65+ years |
45 |
|
Pregnancy |
55 |
|
Lactation |
70 |
(Source: FAO, 2001 2)
Reference for Annex I
1. FAO/WHO. Joint WHO/FAO Expert consultation on diet, nutrition and the prevention of chronic diseases. Geneva: WHO, 2003.
2. FAO/WHO. Human vitamin and mineral requirements. Report of a joint FAO/WHO expert consultation. Rome: FAO, 2002
A. Fruit and vegetables studied for change in nutrients after preparation
| Fruit/vegetable | Preparation method(s) |
|---|---|
|
Chinese flowering cabbage 菜心 |
Boiling; Stir-frying |
|
Chinese lettuce 唐生菜 |
Boiling; Stir-frying |
|
White cabbage 白菜 |
Boiling; Stir-frying |
|
White water spinach 白通菜 |
Boiling; Stir-frying |
|
Broccoli 西蘭花 |
Boiling; Stir-frying |
|
Hairy gourd 節瓜 |
Steaming |
|
Chinese kale 芥蘭 |
Separating leaf and stalk |
|
Angled loofah 絲瓜 |
Peeling |
|
Cucumber 青瓜 |
Peeling |
|
Western pear 啤梨 |
Peeling |
|
Fragrant pear 香梨 |
Peeling |
|
Honey pear 蜜梨 |
Peeling |
|
Green apple 青蘋果 |
Peeling |
|
Fuji apple 富士蘋果 |
Peeling |
|
Red delicious apple 蛇果 |
Peeling |
|
Grape 提子 |
Peeling |
B. Preparation processes of selected fruit and vegetables
1. Peeling of apple, pear, grape, cucumber and angled loofah
- The surface of fruit and vegetables was washed under running tap water.
- For apple, pear, cucumber and angled loofah, the skin was peeled off by a metal peeler
- For grape, the skin was tear off by hand.
2. Separating leaf and stalk of Chinese kale
- The surface of Chinese kale was washed under running tap water.
- The stalk and leaf of Chinese kale was separated by hand.
3. Boiling of Chinese flowering cabbage, Chinese lettuce, white cabbage, white water spinach, and broccoli
- The surface of the vegetables was washed under running tap water.
- The pot was filled with 3 litres of tap water and heated until boiled up. For the other two sets, 1 teaspoon and 1 tablespoon of cooking oil was also added to pot.
- When the water was boiled, two catties of vegetables was added to the pot and boiled for 8 min.
4. Stir-frying of Chinese flowering cabbage, Chinese lettuce, white cabbage, white water spinach, and broccoli
- The surface of the vegetables was washed under running tap water.
- 6 tablespoons of cooking oil was added to the frying pan and heated up.
- Two catties of vegetables was added to the frying pan and cooked by stir-frying for 10 minutes.
5. Steaming of hairy gourd
- The surface of hairy gourd was washed under running tap water and then the skin was peeled off.
- Plenty of water (at least 2 litre) was added to the pot and heated until boiled.
- Two catties of hairy gourd was placed on a stainless steel dish and steamed for 10 minutes.
Testing Methods for Determining Nutrient Contents in Foods
Single-laboratory validated test methods based on the following references:
| Nutrient parameter | Reference |
|---|---|
| Cholesterol | AOAC 994.10 |
| Dietary fibre | AOAC 985.29 |
|
Total nitrogen (for protein) |
AOAC 992.15 and AOAC 992.23 |
|
Saturated fatty acids |
AOAC 996.06 |
|
Total fat |
AOAC 922.06 |
|
Moisture |
International Standard ISO 1442:1997 |
|
Total ash |
International Standard ISO 936:1998 |
|
Sugars |
AOAC 977.20, AOAC 980.13 and AOAC 982.14 |
|
Nutritional elements |
Acid digestion followed by ICP-OES* determination |
Note: All AOAC Official Methods quoted are referred to AOAC Official Method, 17 th edition, 2000 AOAC INTERNATIONAL.
* ICP-OES refers to inductively coupled plasma – optical emission spectrometry
Nutrient parameters by calculation
(a) Energy is calculated as the sum of contents of total fat, protein and carbohydrate multiplying their corresponding conversion factors (i.e. carbohydrate: 4kcal/g, protein: 4kcal/g, fat: 9kcal/g).
(b) Total carbohydrate is calculated by subtracting the sum of moisture, ash, total fat and protein from the total weight of the food sample.
(c) Protein is calculated by multiplying the content of total nitrogen in the food sample with the conversion factor of 6.25.
(d) Saturated fat is the sum of 13 saturated fatty acids including C4:0, C6:0, C8:0, C10:0, C12:0, C14:0, C15:0, C16:0, C17:0, C18:0, C20:0, C22:0 and C24:0.
(e) Sugar is the sum of individual sugars including fructose, glucose, sucrose, maltose and lactose
The definition of "trace"
| Nutrient parameter | Range of "trace" per 100 g |
Range of "trace" per 100 ml |
|---|---|---|
|
Protein |
0.1 – 0.3 g |
0.1 – 0.3 g |
|
Total fat |
0.1 – 0.3 g |
0.1 – 0.3 g |
|
Saturated fat |
|
|
|
C4:0 |
0.0005 – 0.002 g |
0.0005 – 0.002 g |
|
C6:0 |
0.004 – 0.01 g |
0.004 – 0.01 g |
|
C8:0 |
0.005 – 0.02 g |
0.005 – 0.02 g |
|
C10:0 |
0.002 – 0.006 g |
0.002 – 0.006 g |
|
C12:0 |
0.001 – 0.003 g |
0.001 – 0.003 g |
|
C14:0 |
0.002 – 0.006 g |
0.002 – 0.006 g |
|
C15:0 |
0.002 – 0.006 g |
0.002 – 0.006 g |
|
C16:0 |
0.002 – 0.005 g |
0.002 – 0.005 g |
|
C17:0 |
0.002 – 0.005 g |
0.002 – 0.005 g |
|
C18:0 |
0.002 – 0.006 g |
0.002 – 0.006 g |
|
C20:0 |
0.001 – 0.004 g |
0.001 – 0.004 g |
|
C22:0 |
0.002 – 0.007 g |
0.002 – 0.007 g |
|
C24:0 |
0.002 – 0.008 g |
0.002 – 0.008 g |
|
Dietary fibre |
0.4 – 1 g |
0.4 – 1 g |
|
Cholesterol |
0.02 – 0.06 mg |
0.02 – 0.06 mg |
|
Sodium |
2 – 5 mg |
2 – 5 mg |
|
Calcium |
0.4 – 1 mg |
0.4 – 1 mg |
Nutrient Content of Fruit and Vegetables (per 100 g)
| Food item | Energy (kcal) |
Total Carbohydrate (g) |
Protein (g) |
Lipid (g) |
Saturated fat (g) | Cholesterol (mg) | Sugars (g) |
Dietary fibre (g) | Calcium (mg) | Sodium (mg) | Vitamin C (mg) | Remarks |
|---|---|---|---|---|---|---|---|---|---|---|---|---|
Vegetables |
33 |
4.1 |
3.1 |
0.5 |
0.068 |
ND |
17 |
2.7 |
32 |
21 |
100 |
|
|
Angled loofah 絲瓜 |
20 |
4.0 |
1.1 |
Trace |
0.032 |
ND* |
2 |
1.6 |
13 |
0 |
5 |
|
|
Asparagus |
25 |
3.88 |
2.2 |
0.12 |
0.040 |
0 |
1.88 |
2.1 |
24 |
2 |
5.6 |
|
|
Bitter cucumber 苦瓜 |
16 |
3.2 |
0.7 |
0 |
0.019 |
ND |
0.26 |
2.2 |
14 |
0 |
120 |
C |
|
Blanched Chinese chive 韮黃 |
19 |
2.6 |
1.5 |
0.3 |
0.024 |
ND |
1.1 |
1.5 |
29 |
0 |
9 |
|
|
Broccoli 西蘭花 |
33 |
4.1 |
3.1 |
0.5 |
0.068 |
ND |
17 |
2.7 |
32 |
21 |
100 |
D, C |
|
Cabbage 椰菜 |
22 |
4.3 |
1.3 |
Trace |
0.021 |
ND |
2.5 |
1.6 |
46 |
19 |
38 |
|
|
Carrot 甘筍 ** |
41 |
9.58 |
0.93 |
0.24 |
0.037 |
0 |
4.74 |
2.8 |
33 |
69 |
5.9 |
D |
|
Cauliflower |
25 |
5.30 |
1.98 |
0.10 |
0.032 |
0 |
2.40 |
2.5 |
22 |
30 |
46.4 |
|
|
Celery 西芹 ** |
16 |
2.97 |
0.69 |
0.17 |
0.042 |
0 |
1.83 |
1.6 |
40 |
80 |
3.10 |
|
|
Chayote |
17 |
3.90 |
0.82 |
0.13 |
0.028 |
0 |
1.85 |
1.7 |
17 |
2 |
7.7 |
|
|
Chinese cabbage |
16 |
3.23 |
1.20 |
0.20 |
0.043 |
0 |
1.41 |
1.2 |
77 |
9 |
27.0 |
|
|
Chinese chive (Flower Stalks) 韮菜花 |
40 |
6.8 |
2.3 |
0.4 |
0.053 |
ND |
2.8 |
2.9 |
26 |
0 |
31 |
D |
|
Chinese chive 韮菜 |
30 |
4.3 |
2.2 |
0.4 |
0.061 |
ND |
1.4 |
2.4 |
110 |
0 |
21 |
|
|
Chinese flowering cabbage 菜心 |
18 |
1.6 |
2.1 |
0.3 |
0.032 |
ND |
0.44 |
1.5 |
100 |
30 |
37 |
|
|
Chinese kale 芥蘭 |
34 |
4.1 |
3.0 |
0.6 |
0.061 |
ND |
1.1 |
2.3 |
140 |
18 |
90 |
C |
| Food item | Energy (kcal) |
Total Carbohydrate (g) |
Protein (g) |
Lipid (g) |
Saturated fat (g) | Cholesterol (mg) | Sugars (g) |
Dietary fibre (g) | Calcium (mg) | Sodium (mg) | Vitamin C (mg) | Remarks |
|---|---|---|---|---|---|---|---|---|---|---|---|---|
|
Chinese lettuce 唐 生菜 |
8.4 |
1.1 |
1.0 |
Trace |
0.029 |
ND |
0.98 |
Trace |
28 |
8 |
10 |
|
|
Chinese Spinach 莧菜 |
21 |
2.5 |
1.9 |
0.4 |
0.048 |
ND |
0.15 |
2.0 |
140 |
15 |
15 |
|
|
Cucumber 青瓜 |
10 |
1.8 |
0.7 |
Trace |
0.018 |
ND |
1.4 |
Trace |
20 |
0 |
10 |
|
|
Eggplant 茄子 |
26 |
5.6 |
1.0 |
Trace |
0.026 |
ND |
2.5 |
2.6 |
14 |
0 |
3 |
|
|
French bean |
34 |
6.0 |
1.9 |
0.3 |
0.046 |
ND |
2.1 |
2.5 |
49 |
0 |
9 |
|
|
Garden peas |
42 |
7.55 |
2.8 |
0.20 |
0.039 |
0 |
4.00 |
2.6 |
43 |
4 |
60.0 |
|
|
Garland Chrysanthemum 茼蒿 ** |
24 |
3.02 |
3.36 |
0.56 |
NA* |
0 |
NA |
3.0 |
117 |
118 |
1.4 |
D |
|
Green water Spinach 青通 菜 |
23 |
2.9 |
2.0 |
0.4 |
0.071 |
ND |
0.21 |
2.3 |
59 |
32 |
20 |
|
|
Hairy gourd 節瓜 |
20 |
4.1 |
0.8 |
Trace |
0.029 |
ND |
2.1 |
1.5 |
15 |
0 |
71 |
|
|
Honey peas |
48 |
8.6 |
3.3 |
Trace |
0.034 |
ND |
3.3 |
2.2 |
44 |
0 |
39 |
|
|
Indian lettuce |
23 |
3.6 |
1.2 |
0.4 |
0.042 |
ND |
1.4 |
1.7 |
44 |
13 |
17 |
|
|
Lettuce 西生菜 |
11 |
1.9 |
0.9 |
Trace |
0.023 |
ND |
1.6 |
Trace |
57 |
51 |
3 |
|
|
Lotus root |
74 |
17.23 |
2.6 |
0.10 |
0.030 |
0 |
NA |
4.9 |
45 |
40 |
44.0 |
D |
|
Mustard leaf 芥菜 |
27 |
3.4 |
2.1 |
0.5 |
0.057 |
ND |
1.3 |
1.8 |
110 |
9 |
94 |
C |
|
Onions 洋葱 ** |
40 |
9.34 |
1.10 |
0.10 |
0.042 |
0 |
4.24 |
1.7 |
23 |
4 |
7.4 |
|
|
Pea shoots 豆苗 |
38 |
3.8 |
4.2 |
0.7 |
0.075 |
ND |
0.39 |
2.0 |
49 |
Trace |
88 |
C |
|
Pumpkin 南瓜 ** |
26 |
6.50 |
1.00 |
0.10 |
0.052 |
0 |
1.36 |
0.5 |
21 |
1 |
9.0 |
|
| Food item | Energy (kcal) |
Total Carbohydrate (g) |
Protein (g) |
Lipid (g) |
Saturated fat (g) | Cholesterol (mg) | Sugars (g) |
Dietary fibre (g) | Calcium (mg) | Sodium (mg) | Vitamin C (mg) | Remarks |
|---|---|---|---|---|---|---|---|---|---|---|---|---|
|
Peaches 桃 ** |
39 |
9.54 |
0.91 |
0.25 |
0.019 |
0 |
8.39 |
1.5 |
6 |
0 |
6.6 |
|
|
Pineapple |
48 |
12.63 |
0.54 |
0.12 |
0.009 |
0 |
9.26 |
1.4 |
13 |
1 |
36.2 |
|
|
Pomelo 柚子 |
46 |
9.8 |
0.7 |
0.4 |
0.019 |
ND |
7.2 |
1.3 |
14 |
0 |
59 |
|
|
Red delicious apple |
61 |
14 |
Trace |
0.4 |
0.014 |
ND |
12 |
2.4 |
6.3 |
0 |
3 |
S |
|
Starfruit |
31 |
6.73 |
1.04 |
0.33 |
0.019 |
0 |
3.98 |
2.8 |
3 |
2 |
34.4 |
|
|
Strawberry |
32 |
7.68 |
0.67 |
0.30 |
0.015 |
0 |
4.89 |
2.0 |
16 |
1 |
58.8 |
|
|
Mandarin orange 柑 ** |
53 |
13.34 |
0.81 |
0.31 |
0.039 |
0 |
10.58 |
1.8 |
37 |
2 |
26.7 |
|
|
Watermelon 西瓜 ** |
30 |
7.55 |
0.61 |
0.15 |
0.016 |
0 |
6.20 |
0.4 |
7 |
1 |
8.1 |
|
|
Wax jumbo |
37 |
8.6 |
0.6 |
Trace |
0.046 |
ND |
6.7 |
1.0 |
2.3 |
Trace |
11 |
|
|
Western pear 啤梨 |
60 |
15 |
Trace |
Trace |
0.016 |
ND |
7.4 |
3.0 |
6.5 |
0 |
4 |
D |
Juices |
|
|
|
|
|
|
|
|
|
|
|
|
|
Fresh carrot juice |
25 |
5.5 |
0.7 |
Trace |
0.025 |
ND |
3.6 |
Trace |
8.9 |
75 |
3 |
|
|
Fresh mango juice |
44 |
11 |
Trace |
Trace |
0.032 |
ND |
9.3 |
0 |
2.9 |
0 |
25 |
|
|
Fresh orange juice 鮮榨橙汁 |
43 |
10 |
0.7 |
Trace |
0.016 |
ND |
7.7 |
0 |
14 |
0 |
49 |
|
|
Fresh pear juice 新鮮梨汁 |
40 |
10 |
Trace |
Trace |
0.010 |
ND |
8.8 |
0 |
1.2 |
0 |
4 |
|
|
Fresh watermelon juice |
27 |
6.2 |
0.6 |
0 |
0.011 |
ND |
5.3 |
0 |
7.7 |
0 |
6 |
|
* ND = Not determined; NA= Data not available ** Data from USDA SR19
Remarks: C= 5 fruit/vegetables highest in vitamin C; D= 5 fruit/vegetables highest in dietary fibre; S= 5 fruit highest in sugar and 2 high sugar canned fruits; F=High fat fruit
Food item |
Energy |
Total Carbo- hydrate |
Protein |
Lipid |
Saturated fat (g) |
Cholesterol (mg) |
Sugars |
Dietary fibre (g) |
Calcium (mg) |
Sodium (mg) |
Vitamin C (mg) |
Portion |
Weight (g) |
|
Avocado |
161 |
8.58 |
2.01 |
14.74 |
2.137 |
0 |
0.67 |
6.8 |
12 |
7 |
10.1 |
1/2 piece |
101 |
|
Banana |
61 |
15.53 |
0.74 |
0.22 |
0.076 |
0 |
8.32 |
1.8 |
3 |
1 |
5.9 |
1/2 large |
68 |
|
Black currant 黑加侖子 ** |
36 |
8.62 |
0.79 |
0.23 |
0.019 |
0 |
NA |
NA |
31 |
1 |
101.4 |
1/2 cup |
61 |
|
Canned peach |
85 |
21.97 |
0.60 |
0.16 |
0.004 |
0 |
19.57 |
2.4 |
3 |
7 |
3.1 |
1/2 cup |
111 |
|
Canned pineapple |
54 |
14.08 |
0.46 |
0.10 |
0.007 |
0 |
12.91 |
1.2 |
14 |
1 |
8.5 |
1/2 cup chunks |
91 |
|
Dragon fruit 火龍果 |
107 |
19 |
1.9 |
2.5 |
0.228 |
ND |
13.3 |
3.0 |
10.2 |
0 |
15 |
1/2 medium |
175 |
|
Durian 榴槤 ** |
179 |
32.91 |
1.79 |
6.48 |
NA |
0 |
NA |
4.6 |
7 |
2 |
23.9 |
1/2 cup flesh |
122 |
|
Fragrant pear 香梨 |
71 |
17 |
0.4 |
0.4 |
0.016 |
ND |
8.7 |
3.2 |
9.6 |
0 |
4 |
1 medium |
122 |
|
Fuji apple |
80 |
19 |
NA |
0.6 |
0.086 |
ND |
15.2 |
2.3 |
6.8 |
0 |
3 |
1 medium |
138 |
|
Grape 提子 |
51 |
11 |
0.5 |
0.5 |
0.010 |
ND |
10.5 |
NA |
6.2 |
0 |
2 |
1/2 cup |
75 |
|
Grapefruit |
41 |
10.34 |
0.81 |
0.13 |
0.018 |
0 |
8.93 |
1.4 |
15 |
0 |
44.0 |
1/2 medium |
128 |
|
Green apple 青蘋果 |
81 |
19 |
0.4 |
0.4 |
0.066 |
ND |
13.7 |
3.9 |
8.6 |
0 |
6 |
1 medium |
138 |
|
Guava 番石榴 ** |
37 |
8.92 |
1.40 |
0.52 |
0.150 |
0 |
4.91 |
3.0 |
10 |
1 |
125.6 |
1 small |
55 |
|
Honey pear 蜜梨 |
60 |
15 |
0.5 |
NA |
0.007 |
ND |
7.1 |
3.1 |
4.9 |
0 |
4 |
1/2 small |
122 |
|
Kiwi fruit |
46 |
11.14 |
0.87 |
0.40 |
0.022 |
0 |
6.83 |
2.3 |
26 |
2 |
70.5 |
I medium |
76 |
|
Lemons |
24 |
7.83 |
0.92 |
0.25 |
0.033 |
0 |
2.10 |
2.4 |
22 |
2 |
44.5 |
1 piece |
84 |
|
Longan |
29 |
7.27 |
0.63 |
0.05 |
NA |
0 |
NA |
0.5 |
0 |
0 |
40.3 |
15 piece |
48 |
|
Lychee |
63 |
15.70 |
0.79 |
0.42 |
0.094 |
0 |
14.47 |
1.2 |
5 |
1 |
67.9 |
1/2 cup |
95 |
Nutrient Content of Fruit (per portion)
| Food item | Energy (kcal) |
Total Carbo- hydrate (g) |
Protein (g) |
Lipid (g) |
Saturated fat (g) | Cholesterol (mg) | Sugars (g) |
Dietary fibre (g) | Calcium (mg) | Sodium (mg) | Vitamin C (mg) | Portion | Weight (g) |
|---|---|---|---|---|---|---|---|---|---|---|---|---|---|
|
Mango 芒果 ** |
67 |
17.59 |
0.53 |
0.28 |
0.068 |
0 |
15.32 |
1.9 |
10 |
2 |
28.7 |
1/2 large |
104 |
|
Oranges 橙 ** |
62 |
15.39 |
1.23 |
0.16 |
0.020 |
0 |
12.25 |
3.1 |
52 |
0 |
69.7 |
1 medium |
131 |
|
Papaya 木瓜 ** |
27 |
6.87 |
0.43 |
0.10 |
0.030 |
0 |
4.13 |
1.3 |
17 |
2 |
43.3 |
1/2 cup cubes |
70 |
|
Peaches 桃 ** |
58 |
14.31 |
1.36 |
0.38 |
0.029 |
0 |
12.59 |
2.2 |
9 |
0 |
9.9 |
1 medium |
150 |
|
Pineapple |
37 |
9.79 |
0.42 |
0.09 |
0.007 |
0 |
7.18 |
1.1 |
10 |
1 |
28.1 |
1 /2 cup diced |
78 |
|
Pomelo 柚子 |
56 |
12 |
0.9 |
0.5 |
0.023 |
ND |
8.8 |
1.6 |
17.1 |
0 |
72 |
1/5 pc |
122 |
|
Red delicious apple 蛇果 ( 蘋果 ) |
84 |
19 |
NA |
0.6 |
0.019 |
ND |
16.6 |
3.3 |
8.7 |
0 |
4 |
1 medium |
138 |
|
Starfruit |
19 |
4.17 |
0.64 |
0.20 |
0.012 |
0 |
2.47 |
1.7 |
2 |
1 |
21.3 |
1/2 large |
62 |
|
Strawberry 士多啤梨 ** |
23 |
5.53 |
0.48 |
0.22 |
0.011 |
0 |
3.52 |
1.4 |
12 |
1 |
42.3 |
1/2 cup whole |
72 |
|
Mandarin orange 柑 ** |
47 |
11.74 |
0.71 |
0.27 |
0.034 |
0 |
9.31 |
1.6 |
33 |
2 |
23.5 |
1 medium |
88 |
|
Watermelon 西瓜 ** |
23 |
5.74 |
0.46 |
0.11 |
0.012 |
0 |
4.71 |
0.3 |
5 |
1 |
6.2 |
1/2 cup diced |
76 |
|
Wax jumbo |
44 |
10 |
0.7 |
NA |
0.055 |
ND |
8.0 |
1.2 |
2.8 |
NA |
13 |
1 medium |
120 |
|
Western pear 啤梨 |
107 |
27 |
NA |
NA |
0.028 |
ND |
13.2 |
5.3 |
11.6 |
0 |
7 |
1 medium |
178 |
* ND = Not determined; NA= Data not available ** Data from USDA SR19