Risk Assessment Studies
Report No. 18
Chemical Hazard Evaluation
DIETARY EXPOSURE TO LEAD
OF
SECONDARY SCHOOL STUDENTS
May 2005
Food and Environmental Hygiene Department
The Government of the Hong Kong Special Administrative Region
This is a publication of the Food and Public Health Branch of the Food and Environmental Hygiene Department (FEHD) of the Government of the Hong Kong Special Administrative Region. Under no circumstances should the research data contained herein be reproduced, reviewed, or abstracted in part or in whole, or in conjunction with other publications or research work unless a written permission is obtained from FEHD. Acknowledgement is required if other parts of this publication are used.
Correspondence:
Risk Assessment Section
Food and Environmental Hygiene Department
43/F, Queensway Government Offices,
66 Queensway, Hong Kong.
Email: enquiries@fehd.gov.hk
TABLE OF CONTENTS
Reduction of Level of Lead in Leafy Vegetables
Sampling and Treatment of Samples
Reduction of Level of Lead in Leafy Vegetables
Conclusions and Recommendations
Annex: Distribution Curves of Lead Concentrations in Six Food Groups
<
Abstract
This study estimated the dietary exposure to lead of the secondary school students in Hong Kong, assessed the associated health risk and explored measures to reduce the lead exposure.
Dietary exposure to lead was estimated by using the local food consumption data obtained in secondary school students in 2000 and the concentrations of lead in food samples taken from the local market. Laboratory analysis for lead was conducted by the Food Research Laboratory of the Food and Environmental Hygiene Department.
The dietary exposures to lead for average and high consumers of secondary school students were 1.98 and 5.09μg/kg bw/week respectively. Both levels were well below the Provisional Tolerable Weekly Intakes (PTWI) of 25μg/kg bw/week for lead. It can be concluded that both the average and high consumers of secondary school students are unlikely to experience major toxicological effects of lead.
The results also showed that the food group "vegetables", particularly leafy vegetables, was identified as the main dietary source of lead. Surface contaminated lead could be effectively removed by thoroughly soaking and washing of leafy vegetables in water.Lime preserved egg and oysters were found to contain high concentration of lead and they may be significant dietary sources of lead if they are consumed in large amount.
Because of the ubiquitous nature of lead, low levels of lead in foods may be unavoidable. Food trade is recommended to observe good agricultural and manufacturing practices to minimise lead contamination of foods. Members of the public are advised to wash vegetables thoroughly before cooking and have a balanced diet to avoid excessive exposure to lead from a small range of food items.
OBJECTIVE
This study aims to determine the dietary exposure to lead by the secondary school students in Hong Kong, to assess the associated health risk and to explore measures to reduce dietary exposure to lead.
BACKGROUND
2. The Food and Environmental Hygiene Department (FEHD) has conducted a study on "Dietary Exposure to Heavy Metals of Secondary School Students" in 2002, in which three heavy metals, namely mercury, arsenic and cadmium were studied, and a follow-up study on "Dietary Exposure to Mercury of Secondary School Students" in 2004. In view of the adverse effect of lead and public concern, that food is regarded as the main source of exposure and that there is a lack of local exposure data, there is a need to conduct a study to examine the local situation.
3. Lead is a naturally occurring toxic heavy metal which is ubiquitous in the environment as a pollutant. It has widespread industrial uses such as battery production, preparation of paints and petrol, etc. Lead can be present in food as a result of environmental pollution or unintentional contamination during food processing, handling and packaging.
Sources of Lead
4. Lead may enter the environment at any point during mining, smelting, processing, recycling or disposal. Lead is also used in solder applied to water distribution pipes and to seam of cans used to store foods, in bottle closures for alcoholic beverages and in ceramic glazes and crystal tableware, although some of these usages are fading out. Its uses would result in increase of the lead levels in soil, water and air. In some countries where leaded petrol is still used, the major air emission of lead is from combustion of petrol. Atmospheric lead is also a major source of lead in household dust. [1]
5. Lead is present in soils and is transferred to food crops growing on soil. Lead present in air may also deposit on leafy vegetables. Therefore, cereals and vegetables may contain high level of lead. Aquatic food animals may also accumulate lead from contaminated waters and sediments. Shellfish was reported to contain a higher level of lead than fish since the chemical tends to bioconcentrate more in shellfish than in fish. For meat and meat products, since lead accumulates more in the offal, higher level of lead would be present in offal than in the meat tissues. [1]
6. Traditionally, lead compounds have been used for processing lime preserved egg, and therefore a high lead level was detected in the lime preserved egg.
Toxicity
Metabolism
7. After ingestion, the absorption rate of lead ranges from 3% to 80% whereas the typical absorption rates of dietary lead in adults and infants are 10% and 50%, respectively. After absorption, lead is initially distributed to soft tissues throughout the body via blood, and then deposited in bone. Lead is excreted through the kidney and to a lesser extent in the bile while non-absorbed dietary lead is excreted in the faeces. Organic lead may be metabolised to inorganic lead. The concentration of lead in blood is commonly used as biomarker of exposure. Other markers include bone lead concentration, urinary concentration and dentine lead. [2]
Toxicity and Carcinogenicity
8. Lead is a classical chronic toxic chemical. Lead may cause damages to kidneys, the cardiovascular, immune, haematopoietic, central nervous and reproductive systems. Short term exposure to high level of lead can cause gastrointestinal distress, anaemia, encephalopathy and death. [3] The most critical effect of low-level exposure is retarded cognitive and intellectual development in children.[2] Infant, young children and the foetus are more sensitive to toxic effects of lead, especially the damages to central nervous system. [4]
9. The International Agency for Research on Cancer (IARC) of the World Health Organization (WHO) has evaluated the carcinogenicity of lead and lead compounds. IARC considered that there are inadequate evidence for carcinogenicity of both inorganic lead and organolead compounds in human, sufficient evidence for inorganic lead compounds in experimental animals and inadequate evidence for organolead compounds in experimental animals. It classified lead and inorganic lead compounds as Group 2B agent, and organolead compounds as Group 3 agent.[2]
Level of Safe Intake of Lead
10. The Joint FAO/WHO Expert Committee on Food Additives (JECFA) has established a provisional tolerable weekly intake (PTWI) of 25µg/kg bw/ week for lead.
11. PTWI is an estimate of the amount of a contaminant that can be ingested over a lifetime without appreciable risk. An intake above the PTWI does not automatically mean that health is at risk. Transient excursion above the PTWI would have no health consequences provided that the average intake over long period is not exceeded as the emphasis of PTWI is a lifetime exposure.
Sources of Human Exposure
12. Lead exposure can occur through food and water as well as soil and air and the relative contributions from individual sources may depend on life-style and socioeconomic status. It was reported that the main sources of exposure for an adult are food (ranged from 0.4μg/kg bw/week to 10.1μg/kg bw/week) and water (ranged from 0.23μg/kg bw/week to 0.35μg/kg bw/week).[2]
13. Airborne lead may contribute significantly to exposure, depending on various factors such as tobacco smoking, occupation and proximity to sources, which may vary considerably. [1][2] For smokers who smoke 20 cigarettes daily, an additional exposure of lead from cigarette smoking was estimated to be 0.28μg/kg bw/week.[1]
14. The main potential sources of exposure to lead in children are food, air, water and dust or soil. It has been reported that the dietary intakes of children (ranged from 0.6 – 30μg/kg bw/week) could be two to three times that of adults.[2]
15. In other dietary exposures studies such as those conducted in the UK and Mainland China, cereals and vegetables were found to be the main dietary sources of lead, which contributed 31% to 40% of total dietary exposure for cereals, and 23% to 35% of total dietary exposure for vegetables. [5][6]
SCOPE OF STUDY
16. To estimate the dietary exposure to lead, this study covered six major food groups, namely (i) cereals and cereal products, (ii) vegetables, (iii) fruits, (iv) meat, poultry, egg and their products, (v) seafood, (vi) milk and dairy products. The selection was based on the occurrence of lead in those food groups and the consumption patterns.
17. As leafy vegetable was reported to be contaminated with lead through adherence of the lead present in air, the study also explored the measures which can be taken at the consumer level.
METHODOLOGY
Dietary Exposure
Food Consumption Data
18. The food consumption data in this report were extracted from the Food Consumption Survey conducted in local secondary school students in 2000 by FEHD. In the survey, a stratified three-stage sampling plan was used, with a sampling frame of 472 secondary schools and more than 380,000 students, covering almost all the local secondary schools. A total of 967 students from 27 schools participated in the survey yielding a response rate of 77% at the school level and 96% at the student level. The mean weight of the participated students was 52.0 kg. [7]
Sampling Plan
19. Food samples were taken from the local market according to the six food groups as mentioned above. Food items were selected so as to match those in the Food Consumption Survey as well as those with likely occurrence of lead. Three samples of each food item from different sources were taken for analysis.
Laboratory Analysis
20. Laboratory analysis was done by the Food Research Laboratory (FRL) of FEHD. The analysis was conducted mainly in the form of "composite sample". Samples collected randomly from the three different sources were mixed and homogenised. The composite sample was then digested with concentrated acid, followed by determination of lead using inductively coupled plasma mass spectrometry (ICP-MS). The limit of detection (LOD) was 0.6μg/kg.
21. When the analytical value was below the LOD, the true value could be anywhere between zero and the LOD. The treatment for these results was particularly important when a large percentage of the analytical results of a particular food group were below LOD. While it may not be appropriate to assume a zero concentration for all the samples with analytical values below LOD, assigning the non-detects the value of LOD would, however, grossly overestimate the dietary intake. A value of 1/2-LOD was assigned to all results below LOD in this study. Since the levels of contaminants in food, including lead, usually follows a log-normal distribution, assigning a value of 1/2 LOD to all non-detected levels is considered as a conservative approach for food groups in which the majority of food items have levels below the LOD.
Dietary Exposures to Lead
22. Dietary exposure from individual food item was obtained by combining the consumption data and the concentration of individual food items. Daily dietary exposure was multiplied by seven to obtain a weekly exposure level. Total exposure for each student was obtained by summing exposures from all food items. The mean and 95th percentile of the weekly exposure levels were used to represent the average dietary exposure and the exposure for high consumers respectively.
23. The estimated weekly exposure levels were then compared with the PTWI as established by JECFA.
Reduction of Level of Lead in Leafy Vegetables
Sampling and Treatment of Samples
24. Two varieties of leafy vegetables were selected based on the findings of the initial results. Three samples of each variety from different sources were taken for analysis. The six leafy vegetables samples were subject to soaking in water for 30 minutes, washed in running water for 1 minute, and then cooked in boiling water for 3 minutes. The levels of lead in the samples were determined at different stages: (i) raw and as sold, (ii) after soaking and washing, and (iii) after boiling.
25. Another sets of bak choi and flowering cabbages samples were also obtained and they were subject to cooking in boiling water without prior washing or soaking. The levels of lead were determined (i) raw and as sold and (ii) after boiling.
RESULTS
Food Consumption Data
26. Food consumption data for the six food groups are given in Table 1.
Table 1: Food Consumption for Secondary School Students
| Food groups | Mean consumption (g/day) |
|---|---|
| Cereal and cereal products | 478.0 |
| Vegetables | 295.3 |
| Fruits | 309.1 |
| Meat, poultry, egg and their products | 189.4 |
| Seafood | 122.4 |
| Milk and dairy products | 143.2 |
Concentration of Lead in Food
27. A total of 345 food samples were taken and combined into composite samples and 117 analyses were done. The results are given in Table 2.
Table 2: Number of Samples Taken and Median Concentrations for Lead in Six Food Groups
| Food groups | Number of samples | % of samples below LOD | Median concentration (μg/kg) |
|---|---|---|---|
| Cereal and cereal products | 45 | 93.3 | <LOD* |
| Vegetables | 81 | 3.7 | 14.2 |
| Fruits | 21 | 71.4 | <LOD * |
| Meat, poultry, egg and their products | 99 | 63.6 | <LOD * |
| Seafood | 84 | 10.7 | 7.6 |
| Milk and dairy products | 15 | 100.0 | <LOD * |
(* a value of 1/2 LOD was assigned, i.e. 0.3μg/kg)
28. Lead was detected in most of the samples of the two food groups "vegetables" and "seafood". For the other food groups except "milk and dairy products", lead was detected at low levels in most of samples. As for "milk and dairy products", lead was not detected in all the samples. The distribution curves of lead concentration in the six food groups are given in Annex.
Dietary Exposures to Lead
Average Secondary School Students
29. The dietary exposure to lead for average secondary school students was estimated to be 1.98μg/kg bw/week. The main dietary source of lead was "vegetables" which contributed to 57.7% of the total exposure. This was followed by "meat, poultry, egg and their products" and "seafood" which contributed 21.1% and 15.4% of the total exposure respectively. Dietary exposures to lead from different food groups are shown in Table 3.
Table 3: Estimated Dietary Exposure to Lead for Average Secondary School Students
| Food groups | Dietary exposure to lead in μg/kg bw/week (% contribution) |
|---|---|
| Cereal and cereal products | 0.03 (1.7%) |
| Vegetables | 1.14 (57.7%) |
| Fruits | 0.07 (3.7%) |
| Meat, poultry, egg and their products | 0.42 (21.1%) |
| Seafood | 0.31 (15.4%) |
| Milk and dairy products | 0.01 (0.3%) |
| Total | 1.98 (100%) |
(*Figures may not add up to total due to rounding)
High Consumers
30. Further analysis was undertaken to estimate the risk that high consumers might be exposed to. The 95th percentile exposure level of the secondary school students was used to represent the dietary exposure to lead for high consumers and was estimated to be 5.09μg/kg bw/week. (Table 4)
Table 4: Comparison between PTWI Established by JECFA and Dietary Exposures to Lead for Average Secondary School Students and High Consumers
| JECFA PTWI (μg/kg bw/week) | Exposure (μg/kg bw/week) (% of PTWI) | |
|---|---|---|
| Average secondary school students | High Consumers | |
| 25 | 1.98 (8%) | 5.09 (20%) |
Reduction of level of lead in leafy vegetables
31. The levels of lead in the leafy vegetable samples which had been subject to soaking, washing, and/ or boiling in water are given in Table 5 and Figure 1. For comparison, the levels of lead in samples which subjected to boiling in water only are given in Table 6.
Table 5:Change in Concentration of Lead in Leafy Vegetables after Soaking, Washing and Boiling
| Samples | Lead concentration (μg/kg) | ||
|---|---|---|---|
| Raw | After soaking & washing (% reduction compare with raw) |
After further boiling (% reduction compare with raw) |
|
| Bak choi | |||
| Sample #1 | 26 | 23 (-12%) | 23 (-12%) |
| Sample #2 | 71 | 18 (-75%) | 25 (-65%) |
| Sample #3 | 78 | 29 (-63%) | 33 (-58%) |
| Flowering cabbage | |||
| Sample #4 | 51 | 27 (-47%) | 33 (-35%) |
| Sample #5 | 84 | 30 (-64%) | 34 (-60%) |
| Sample #6 | 110 | 35 (-68%) | 37 (-66%) |
| Mean | 70 | 27 (-61%) | 31 (-56%) |
Figure 1: Change in Concentration of Lead in Leafy Vegetables After Soaking, Washing and Boiling
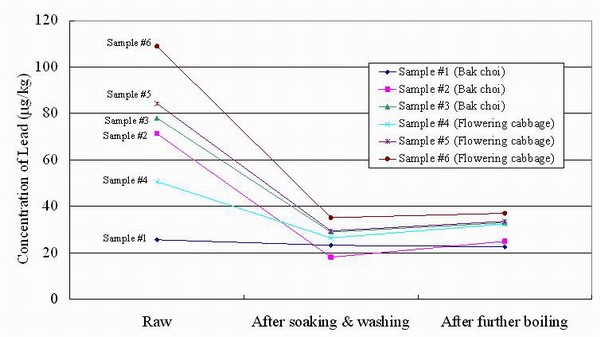
32. The mean concentration of lead in the leafy vegetables decreased from 70μg/kg to 27μg/kg (61% reduction) after soaking and washing and to 31μg/kg after further boiling. The mean percentage reduction in lead concentration after soaking, washing and boiling in water was 56% (range: 12% to 66%). However, the mean concentration of lead in another set of samples of leafy vegetables decreased from 170μg/kg to 150μg/kg after boiling in water only (without soaking and washing), and this amounted to 12% of reduction in concentration (range: 7% to 15%).
Table 6: Change in Concentration of Lead in Leafy Vegetables after Boiling Only
| Samples | Lead concentration (μg/kg) | % of reduction after boiling only | |
|---|---|---|---|
| Raw | After boiling only | ||
| Bak choi | 140 | 130 | -7% |
| Flowering cabbage | 200 | 170 | -15% |
| Mean | 170 | 150 | -12% |
DISCUSSION
Dietary Exposure
33. The dietary exposure to lead for an average secondary school student was estimated to be 1.98μg/kg bw/week while that for the high consumer was 5.09μg/kg bw/week. These exposures amounted to 8% and 20% of the PTWI respectively. Exposures to lead for an average secondary school and the high consumer were both well below the PTWI established by JECFA.
34. Therefore, the dietary exposure estimates suggested that the average secondary school students and high consumers were unlikely to experience major undesirable health effects of lead.
35. In our study, the main dietary source of lead was "vegetables" which contributed to 58% of the total exposure, and leafy vegetables are particularly significant source. In other dietary exposures studies such as those conducted in the UK and Mainland China, cereals were identified as the main contributor (31 to 40% of dietary exposure) and vegetables ranked second (23% to 35% of dietary exposure). In our study, cereal accounted for only 2% of dietary exposure. This discrepancy is mainly due to the lower levels of lead detected in cereal and cereal products in our study as compared with those detected in studies in the UK and Mainland China.
36. Following "vegetables", the food group "meat, poultry, egg and their products" ranked second in terms of contribution to dietary exposure to lead and this was followed by "seafood" (21% and 15% of dietary lead exposures respectively).
37. The food group "meat, poultry, egg and their products" was further analysed and the lead level of more than 60% of the samples in the food group were below LOD. However, lime preserved eggs were found to have the highest level of lead (mean: 1.2mg/kg). This food item alone accounted for 17% of total dietary exposure to lead, or 79% of the contribution by this food group in total. Excluding lime preserved egg, dietary exposure to lead from other foods in the group was only 0.09μg/kg bw/week, or 5% of total dietary exposure.
Lime Preserved Eggs
38. It was noted that there are different patterns of lead levels in lime preserved eggs. The levels in one composite sample and one individual sample were 1.8mg/kg and 1.5mg/kg respectively, whereas those in another two individual samples were 0.006mg/kg and 0.001mg/kg respectively. Traditionally, lead oxide has been used in the production of lime preserved egg to accelerate the coagulation process [8], and a high lead content may be found in such lime preserved eggs. Alternate methods are available which use copper or zinc compounds instead of lead oxide. [9] These alternative methods may result in lower levels of lead in the finished products than those prepared by the traditional methods of using lead oxide. It has been reported that the levels of copper and zinc in the finished products by using the alternative methods were as high as 13mg/kg [10] and 19mg/kg [11] respectively. Copper and zinc are essential micronutrients and with such levels in lime preserved eggs and consumption pattern, toxicity of copper and zinc from lime preserved egg is not expected.
Oysters
39. Following lime preserved eggs, oysters were found to have the second highest level of lead (mean: 0.29mg/kg). Exposure to lead from oysters accounted for 8% of total dietary exposure, or half of the contribution by the food group "seafood".
Reduction of Lead in Leafy Vegetables
40. Leafy vegetables were found to be the major contributor (45%) to the total exposure to lead. It has been reported in literature that lead in plants may be resulted from both deposition from air leading to surface contamination and uptake from the soil.[1]
41. Our findings suggested that a significant portion (more than half) of lead could be removed from the leafy vegetables by soaking and washing in water. Cooking in boiling water alone is not as effective in reducing the level of lead as compared with soaking and washing, since the process of soaking and washing in water could remove the surface contamination of leafy vegetables. It was found that the level of lead increased slightly after further boiling and it may be due to the change in moisture content during processing.
International Comparison
42. Dietary exposures to lead in 1990s in other studies were reviewed and were summarised in Table 7.
43. It can be seen that the dietary exposure estimated in our study compares favourably to exposure estimates obtained from other studies. However, direct comparison of the data has to be done with caution due to the differences in time when the studies were carried out, research methodology, food group categorisation, methods of collection of consumption data, methods of contaminant analysis and methods of treating results below detection limits.
Table 7: A Comparison of Average Weekly Exposure of Lead [2]
| Country / Region | Average weekly dietary exposure (µg/ kg bw/week) |
|---|---|
| Mainland China | 10.1 |
| France | 8.3 |
| Australia | 4.9 |
| New Zealand | 3.3 |
| UK | 3.3 |
| Canada | 2.4 |
| Hong Kong | 2.0* |
| Finland | 1.4 |
| US | 0.4 |
* The exposure data in Hong Kong is extracted from our current study.
Other Sources of Lead Exposure
44. Apart from food, tobacco smoke, air and water may also contribute significantly to lead exposure. For smokers who smoke 20 cigarettes daily, an additional exposure of lead from cigarette smoking was estimated to be 0.28μg/kg bw/week, and this accounted for an extra of about 15% of our current dietary exposure. [1]
45. According to data from the Environmental Protection Department and the Water Supplies Department, the annual average ambient levels of lead in air ranged from 43 – 56 ng/m3 in 2002 [12] and the average level of lead in our drinking water was <0.003 mg/L in water for the period of October 2003 – September 2004 [13]. Assuming that the respiratory volume in a 60-kg adult is 20 m3/day[1] and volume of water consumed is 2 litre/day[4] respectively, exposure to lead from air was estimated to be 0.10 – 0.13μg/kg bw/week and that from drinking water was estimated to be < 0.7μg/kg bw/week. Hence, the main source of exposure to lead was food (over 70% of exposure for non-smokers). Taking exposure from water into account, exposure to lead was still far below the PTWI.
Environmental Measures
46. To reduce the human exposure to lead globally, the use of lead and lead compounds should be reduced and the lead-containing emissions should be minimised. The restrictions on industrial emission and on the use of leaded petrol would result in lower lead levels in air.[1] Although it is not targeted specifically at food, such restrictions have also contributed to declining lead levels in food.[3] For example, in the US, the use of lead-containing petrol additives has been reduced since 1980s, and a marked decrease (about 65% reduction) in lead intake from food in 2-year-old infants over a four-year period from 1986 to 1990 was observed.[1] Other measures, such as restriction of the use of lead-soldered cans, control of lead levels in water, reduction of leaching from lead-containing vessels or restriction of their use for storing food, could also reduce the lead exposure from food.[3]
47. In Hong Kong, the sale and supply of leaded petrol was banned since April 1999 and the ambient lead concentrations remain at low levels.[12]
48. To reduce lead exposure from food effectively, the Codex Committee on Food Additives and Contaminants (CCFAC) has developed a "Code of Practice for the Prevention and Reduction of Lead Contamination in Foods" and this set of guidelines has been adopted in 2004. A number of measures to reduce lead exposures are included in the guidelines, regarding agricultural, manufacturing and consumer practices.
LIMITATIONS
49. The methodology for collection of food consumption data may influence the accuracy of the estimates on dietary exposure. In the Food Consumption Survey, the food consumption pattern of secondary school students was collected using a food frequency questionnaire. Although the food frequency questionnaire was very comprehensive, it was not possible to cover every single food item, some of which might be relevant to lead exposure. Furthermore, only the data of consumption pattern for secondary school students is available. To produce more accurate estimates, FEHD is in the process of conducting a population-based food consumption survey which would allow more comprehensive exposure studies to be conducted in the future.
50. Three samples for each food item were taken combined into one composite sample for laboratory analysis. Although more than 300 samples were taken in the study, increasing the number of sample for each food item for laboratory analysis could provide a more precise estimate of the mean lead concentration for the particular food item. However, the number of samples taken have to be balanced with the required resources and number of food items to be included.
51. Lead exposures from individual sources may vary greatly, which depends on the life-style and socioeconomic status. This study mainly focused on lead exposure from food and sources like cigarette smoking, water and air were addressed. However, other sources of exposures, such as those from dust and soil, were not covered in the present study.
CONCLUSIONS AND RECOMMENDATIONS
52. The dietary exposures to lead were 1.98 and 5.09 µg/kg bw/week for average secondary school students and high consumers respectively. They were all well below the PTWI established by JECFA. It can be concluded that both the average and high consumers among secondary school students are unlikely to experience major toxicological effects of lead.
53. The food group "vegetables" was identified as the main dietary source of lead and leafy vegetables are particularly important. The level of lead in leafy vegetables can be effectively reduced by thorough soaking and washing in water before cooking.
54. Lime preserved eggs and oysters were found to contain high concentration of lead and they may be significant dietary sources of lead if they are consumed in large amount.
55. Food is recognised as the major source of lead exposure. Because of the ubiquitous nature of lead in the modern industrial world, low levels of lead in foods may be unavoidable. However, the food trade is advised to observe good agricultural and manufacturing practices to minimise lead contamination of foods, such as avoid using lead compounds as pesticides or for food production.
56. The public is advised to soak and wash vegetables thoroughly to remove dust and soil and to reduce the level of lead. Before preparing food, washing hands would also help remove any lead-contaminated dust or soil from hands.
57. A balanced diet is essential to avoid excessive exposure to lead from a small range of food items.
REFERENCES
[1] WHO. Inorganic Lead. EnvironmentalHealth Criteria 165. Geneva: WHO; 1995.
[2] WHO. Lead.WHO Food Additives Series 44. Geneva: WHO; 2000.
[3] FAO/WHO.Code of Practice for the Prevention and Reduction of Lead Contaminationin Foods (CAC/RCP 56-2004). Rome: FAO/WHO; 2004.
Available from: http://www.codexalimentarius.net/download/standards/10099/CXC_056_2004e.pdf[4] WHO. Leadin Drinking-water: Background document for development of WHO Guidelinesfor Drinking-water Quality. Geneva: WHO; 2003.
[5] Chen J, GaoJ. The Chinese Total Diet Study in 1990. Part I. Chemical Contaminants.Journal of AOAC International 1993; 76(6):1193-1205.
[6] Food StandardAgency (FSA) of UK. 2000 Total Diet Study of 12 elements- aluminium,arsenic, cadmium, chromium, copper, lead, manganese, mercury, nickel,selenium, tin and zinc. Food Surveillance Information Sheet No. 48/04.UK: FSA; 2004. Available from: http://www.food.gov.uk/multimedia/pdfs/fsismetals.pdf
[7] FEHD. FoodConsumption Survey 2000. Hong Kong: FEHD; 2001.
[8] Hou HC. Eggpreservation in China. [cited 16 Feb 2005] Available from: http://www.unu.edu/unupress/food/8F032e/8F032E03.htm
[9] Zhang ZJ.[New Technologies and Recipes on Processing of Egg Products.] [Articlein Chinese] Beijing: Scientific and Technical Documents Publishing House;2001. p.76 – 83
[10] TaiwanDepartment of Health. [Survey on Lead and Copper Contents in Eggs] [Articlein Chinese] [cited 9 March 2005] Taiwan: Taiwan Department of Health;2000. Available from: http://www.nlfd.gov.tw/compare/89/0620.doc
[11] Liu XFand Zou Q. [New Technology on the Production of the Preserved QuailEggs as Compared with Preserved Duck Eggs] [Article in Chinese] Scienceand Technology of Food Industry 1994; 2: 29-32
[12] EnvironmentalProtection Department of HK. Air Quality in Hong Kong 2002. [cited 4Aug 2004] Available from: http://www.epd.gov.hk/epd/english/environmentinhk/air/air_quality/files/aqr02e.pdf
[13] WaterSupplies Department of HK. Drinking Water Quality for the Period October2003 – September 2004. [cited 8 Mar 2005] Available from: http://www.info.gov.hk/wsd/en/html/pdf/wq/drinking_b-e.pdf
ANNEX